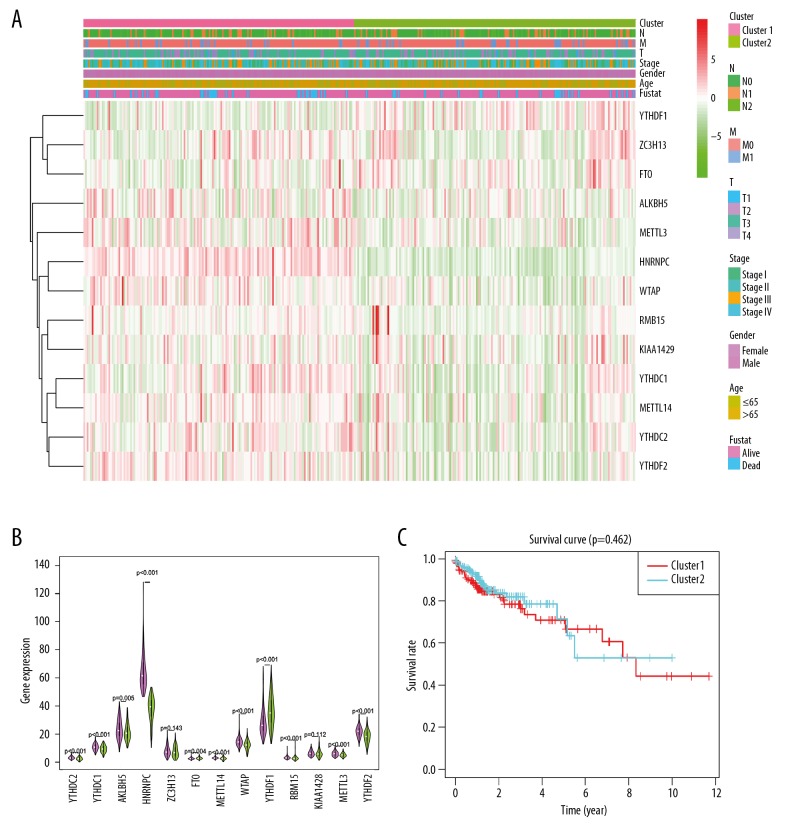
Figure 4.
Comparison of clinical characteristics and expression of m6A RNA methylated regulators between 2 subgroups of samples divided into 2 groups by consistent cluster analysis. (A) m6A RNA methylation regulators consistently express the thermographic and clinicopathological features of the 2 defined clusters (RM1/2). (B) The violin diagram shows the comparison of the median values of 13 m6A RNA methylated regulatory factors in 2 clusters of colorectal adenocarcinomas, and the location of the white spot represents the median value of expression. * P<0.05, <0.01, <0.001, <0.0001. (C) Comparison of overall survival (OS) curve Kaplan-Meier OS rate in patients with and colon cancer.

