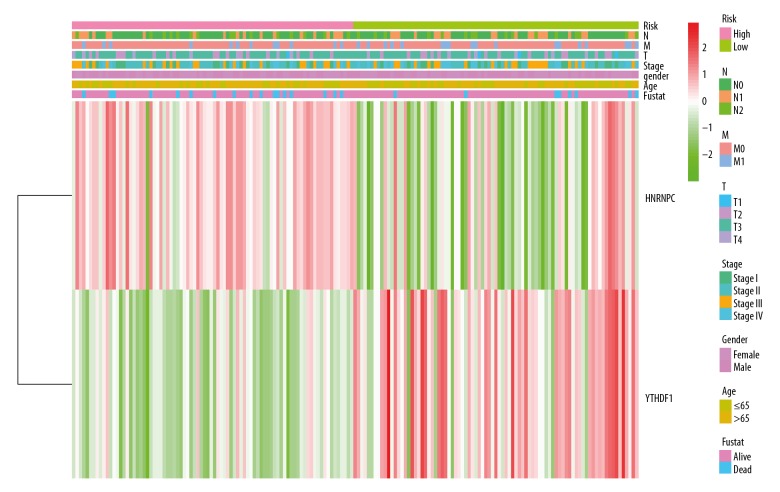
Figure 6.
Comparison of clinicopathological characteristics and expression of HNRNPC and YTHDF1 in 2 groups after grouping based on risk characteristics. The heatmap shows the clinical characteristics of high-risk group and low-risk group. Different colors represent different clinical features and the expression of 2 m6A RNA methylation regulatory factors.

