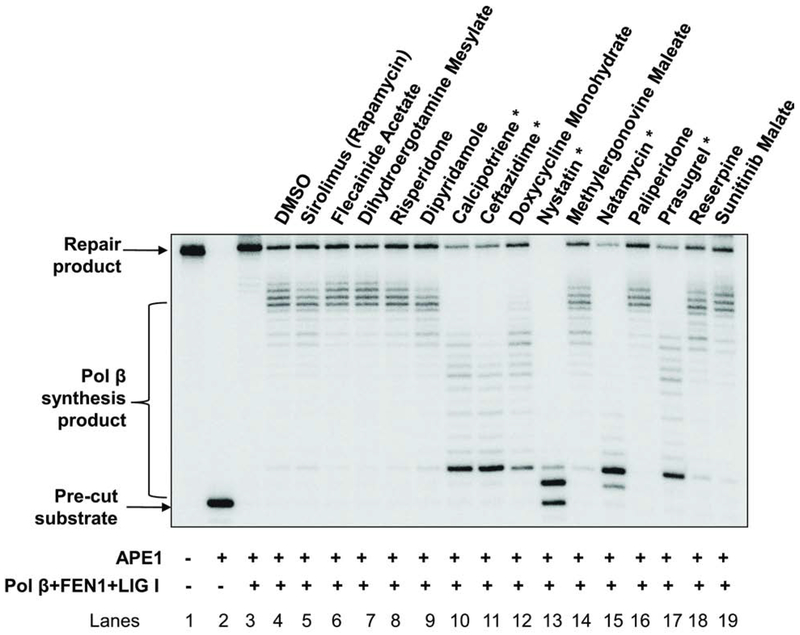
Figure 2. Secondary screen of BER inhibitors.
The secondary screening assay was performed as described in the “Materials and Methods”. Lane 1 represents the substrate only. Lane 2 indicates the reaction mixture with 5 nM APE1. Lanes 3 and 4 correspond to the reaction mixture with 5 nM APE1, 10 nM pol β, 10 nM FEN1 and 20 nM LIG I in the absence and presence of DMSO. Lanes 5 through 19 correspond to the reaction mixture with 5 nM APE1, 10 nM pol β, 10 nM FEN1 and 20 nM LIG I in the presence of indicated compounds. The experiments were repeated at least three times. A representative gel is illustrated. “*” denotes the hit compounds that exhibited significant BER capacity inhibitory effects in the secondary screening assay.

