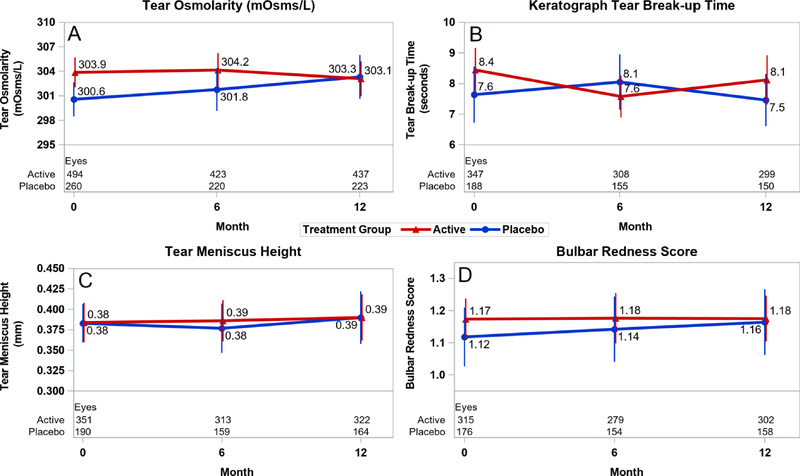
Figure 1.
Mean level of continuous exploratory outcomes at baseline and through 12 months by treatment group. Red line denotes the active group and blue line denotes the placebo group. Vertical bars denote 95% confidence intervals. A) tear osmolarity; B) keratograph tear break-up time; C) tear meniscus height; and D) bulbar conjunctival redness score.

