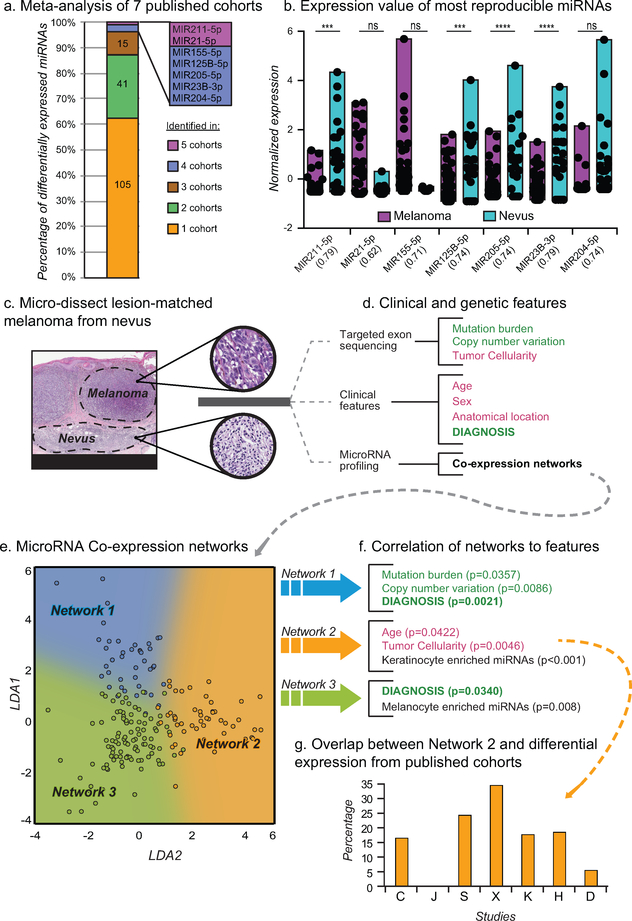
Figure 1: Tumor cellularity and age confound miRNA profiling of melanoma samples.
a) Differential miRNA expression signatures between nevi and melanoma from 7 studies (Table S1–2). b) Normalized expression of common differentially expressed miRNAs. AUC of classification using each microRNA in parenthesis. c) Micro-dissected melanomas with adjacent precursor nevus regions (scale bars, black = 4mm, grey = 300μm). d) Features obtained for each region using targeted exon sequencing (genetic features) or the pathology requisition form (clinical features). Potentially confounding features (red) and target features (green) are highlighted. e) Scatter plot of expressed miRNAs separated by LDA trained on three coexpression networks (blue, orange, and green). F) Correlation between miRNA coexpression networks and features from (d). p values calculated from correlation coefficient. g) Percent of differentially expressed miRNAs from (a) in Network 2.

