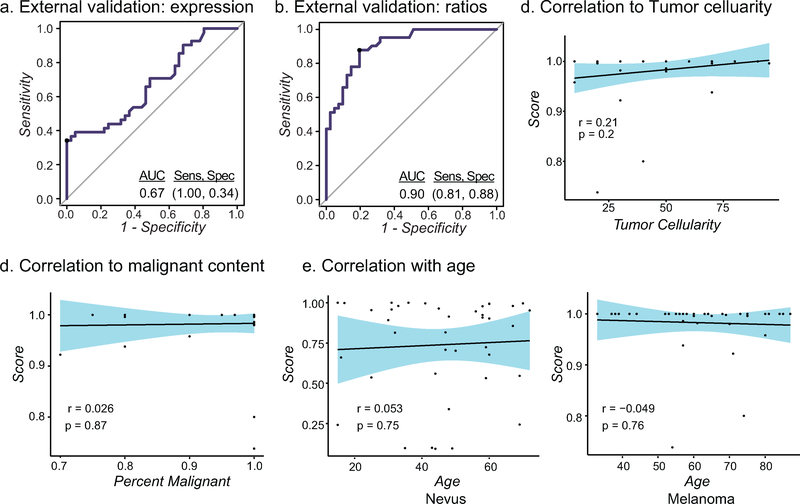
Figure 3: MiRTM validation.
a-b) ROC curve for external validation cohort using model trained with miRNA expression (a) or miRNA ratios (b, MiRTM) from the combined published cohort with the random forest classifier. c-e) Correlation of MiRTM score with percent tumor cell content (c), malignant content (d) or age (e). 95% CI is shown in blue.

