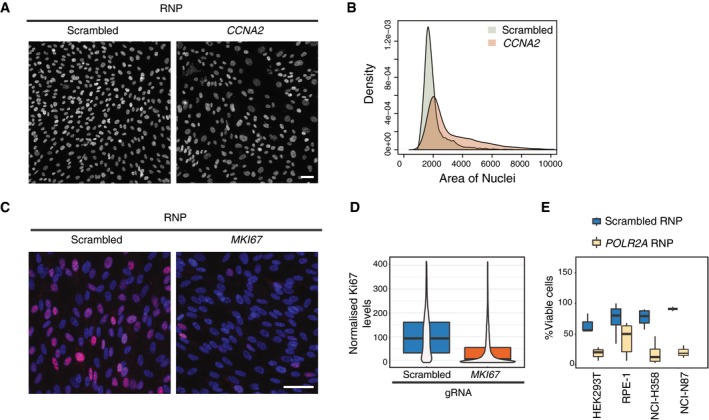
Solid‐phase transfection of nontargeting (scrambled) or CCNA2 targeting RNP complexes into WT RPE‐1TP53−/− cells. Cells were fixed after 72 h and imaged after DNA staining with Hoechst. Scale bar, 50 μm.
Quantification of experiments in (A). Data derived from two independent experiments. P value (scrambled versus CCNA2) < 2e−16, Kolmogorov–Smirnov test.
Solid‐phase transfection of nontargeting (scrambled), MKI67 targeting RNP complexes into WT RPE‐1TP53−/− cells. Cells were fixed after 72 h, stained with Ki67 antibody (red), and Hoechst (blue) to mark DNA and imaged. Scale bar, 50 μm.
Quantification of experiments in (C). Data derived from two independent experiments. Data is represented as violin plots merged with boxplots that extends from min to max together with the probability density. Boxes indicate 25th and 75th percentiles. Black lines indicate median values. P value (scrambled versus MKI67) < 2e−16, Mann–Whitney U test.
Four cell lines were transfected with RNP complexes with scrambled or POLR2A targeting gRNA. 5 days post‐transfection, cell viability in each well was measured. Results are from at least three independent experiments containing three technical replicates. In the boxplots, centerlines mark the medians, box limits indicate the 25th and 75th percentiles, and whiskers extend to 5th and 95th percentiles. For all cell lines, P values (scrambled versus POLR2A) < 0.005. Mann–Whitney U test.

