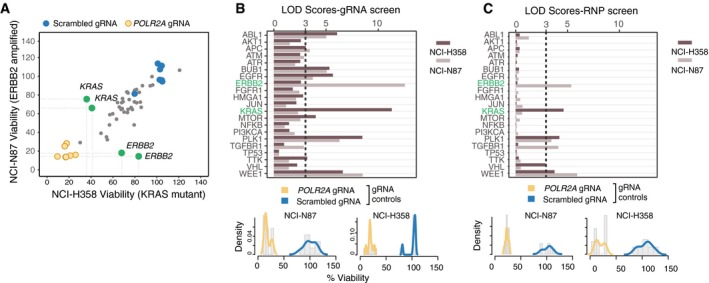
Figure 4. Arrayed CRISPR screens using solid‐phase transfection.

-
AViability of NCI‐N87 and NCI‐H358 cells upon transfection of 45 different gRNAs by solid‐phase transfection. Cas9‐expressing NCI‐N87 and NCI‐H358 cells were seeded on pre‐coated plates. Five days post‐transfection, cell viability in each well was measured by CellTiter‐Glo. Values were background subtracted, normalized to scrambled controls, and plotted against each other. Blue dots represent scrambled controls, whereas the yellow dots represent POLR2A gRNAs. Green dots represent the genes that affect the viability in a cell line‐dependent manner. Results are representative of three independent experiments.
-
B, CLogarithm of the odds (LOD) scores of cancer‐associated gene KOs in NCI‐N87 and NCI‐H358 cells derived from screens with gRNAs (B) and RNPs (C). Bottom panels show distribution of positive (POLR2A) and negative (scrambled) controls for each experiment. LOD score of 3 is highlighted with a dashed line, indicating statistical significance.
