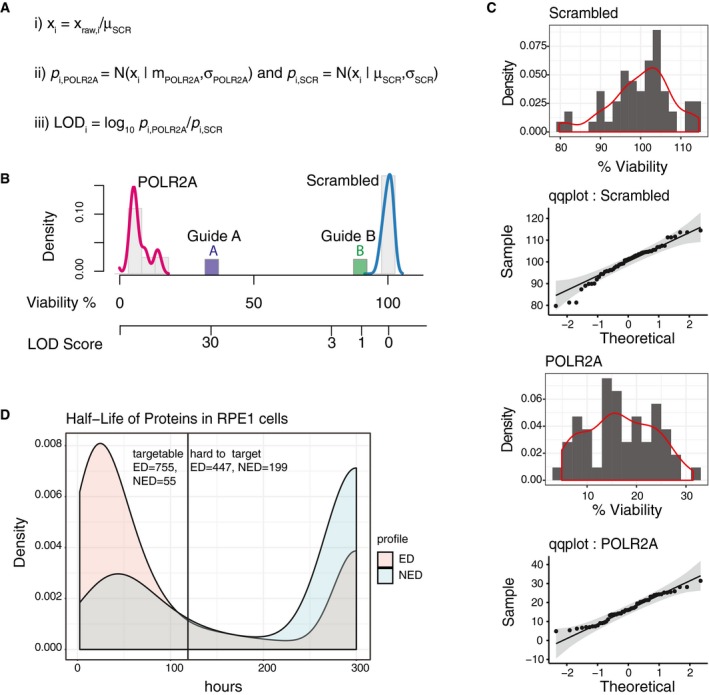
Figure EV5. Assessment of high‐throughput screens based on cell viability.

- Calculation of LOD scores for effect on viability of guide RNA transfection: (i) Normalized values of viability were obtained by ratio of each guide to scrambled control transfection. (ii) Normal distribution of probabilities for each guide was calculated using cumulative normal distribution function using normalized values and mean values of controls. LOD scores were calculated for each guide using values generated in (iii) using the formula shown.
- An example of LOD score and viability graph. Density graphs show positive and negative control guides and their normal distribution. Guide A targets a gene causes strong loss of viability with a high LOD score, whereas guide B shows no loss of viability, with a low LOD score.
- Controls for normality. Distribution and qqplots of control guides used in our study. Distributions of the control guides were tested by a Kolmogorov–Smirnov test. We have not observed any significant differences to normally distributed samples.
- Prediction of proteins that can be targeted by arrayed CRISPR/Cas9‐based screens. Using the dataset from McShane et al, we considered 1‐state degradation model for exponentially degraded proteins (ED) and 2‐state degradation model for non‐exponentially degraded (NED) proteins. The densities of all the proteins are plotted and classified as “targetable” and “hard to target” in CRISPR/Cas9‐based arrayed screens based on a threshold of 120‐h half‐life.
