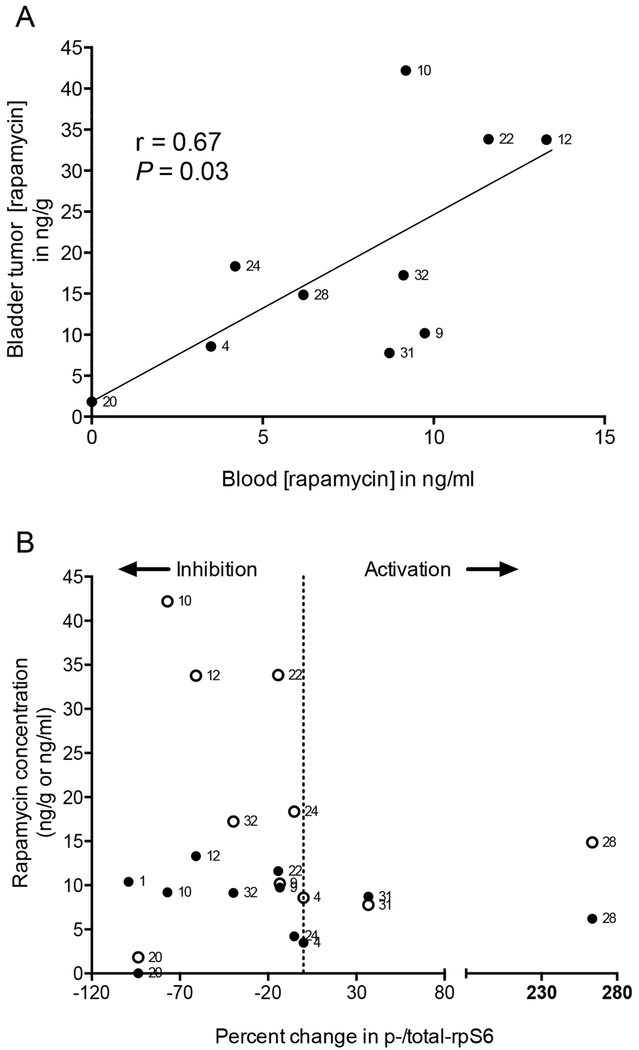
Figure 2. Rapamycin concentrations and PD effects in BC.
For patients on treatment, blood and tissue concentrations of rapamycin were analyzed 30 days after randomization (time of cystectomy) and measured using mass spectrometry. (A) Scatter plot showing individual blood and corresponding bladder tumor tissue rapamycin concentrations. Number next to each point represents subject number. P represents two-tailed test of Pearson correlation coefficient (r) for n=10 patients with available rapamycin concentrations. P value threshold for significance ≤0.05. (B) Scatter plot showing individual rapamycin bladder tumor tissue concentrations (filled symbols expressed as ng/g) and peripheral blood concentrations (open symbols expressed as ng/mL) across percentage change in p-/total rpS6 (before and after rapamycin) among rapamycin-treated patients with evaluable tissue for biomarker assessment (n=11). Vertical line at 0% change in p-/total rpS6 defines activation versus inhibition. Data are from one representative experiment.

