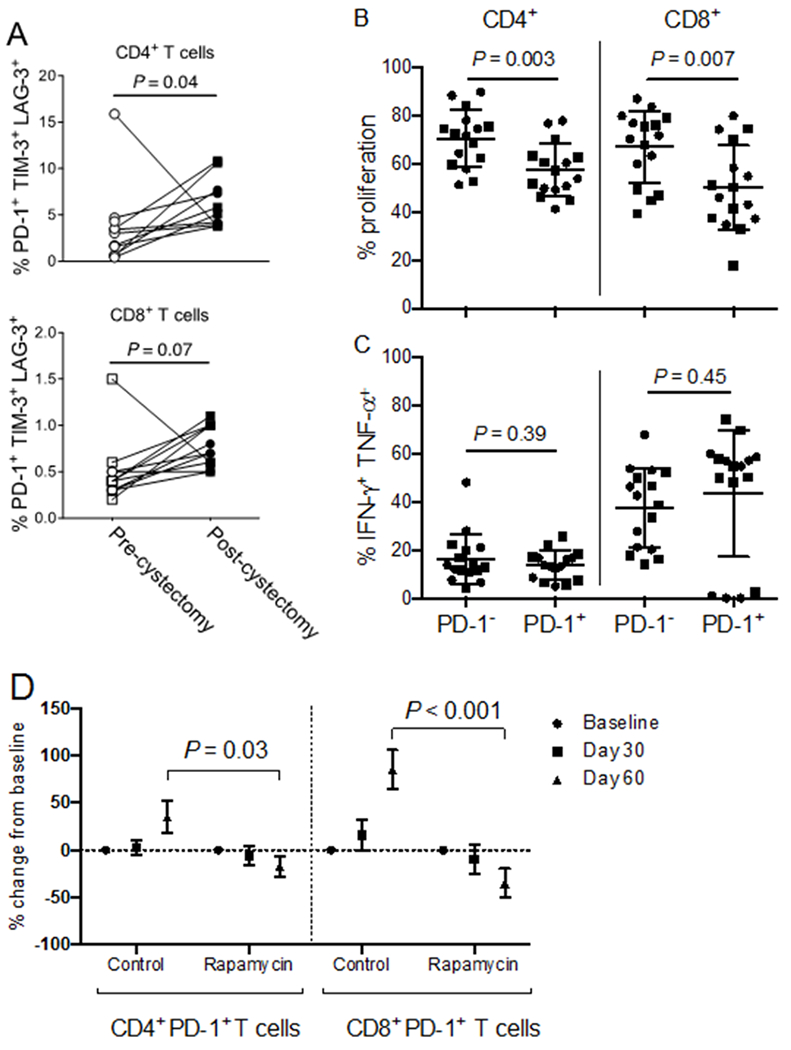
Figure 3. PD-1+ T cells are less proliferative than PD-1− T cells in patients with BC, and rapamycin decreases T-cell exhaustion.

Peripheral blood mononuclear cells (PBMCs) from patients on trial. (A) Patients (n=11) with sufficient PBMCs were analyzed at baseline (before cystectomy) and at 60 days from registration. Phenotypes were determined using flow cytometry gated from live CD45+CD3+CD4+ (top) or CD45+CD3+CD8+ (bottom) lymphocytes. Proportion of cells co-expressing LAG-3, TIM-3, and PD-1 was analyzed. P: two-tailed Wilcoxin matched-pairs signed rank test. (B-C) PBMCs were sorted to high purity based on CD3+PD-1+ versus CD3+PD-1− T cell surface expression using fluorescence-activated cell sorting (n=16 patients). Cells were stained with CFSE and stimulated in vitro with CD3/CD28 Dynabeads in a 1:1 cell to bead ratio. After three days, cells were stained for CD4 and CD8 and analyzed using flow cytometry for (B) proliferation or (C) cytokine expression. P: unpaired, two-tailed t tests. Circles represent control patients (n=8). Squares represent rapamycin-treated patients (n=8). (D) The proportion of PD-1+ T cells among live CD45+CD3+CD4+ and live CD45+CD3+CD8+ T cells was determined using flow cytometry and analyzed as a percentage change from baseline for patient with sufficient material (n=8 controls and n=9 rapamycin). Results shown as mean±SEM. The mean values at specified time points were compared for control versus rapamycin-treated groups. P: unpaired, two-tailed t-tests. P value threshold for significance < 0.05. Data are from one representative experiment.
