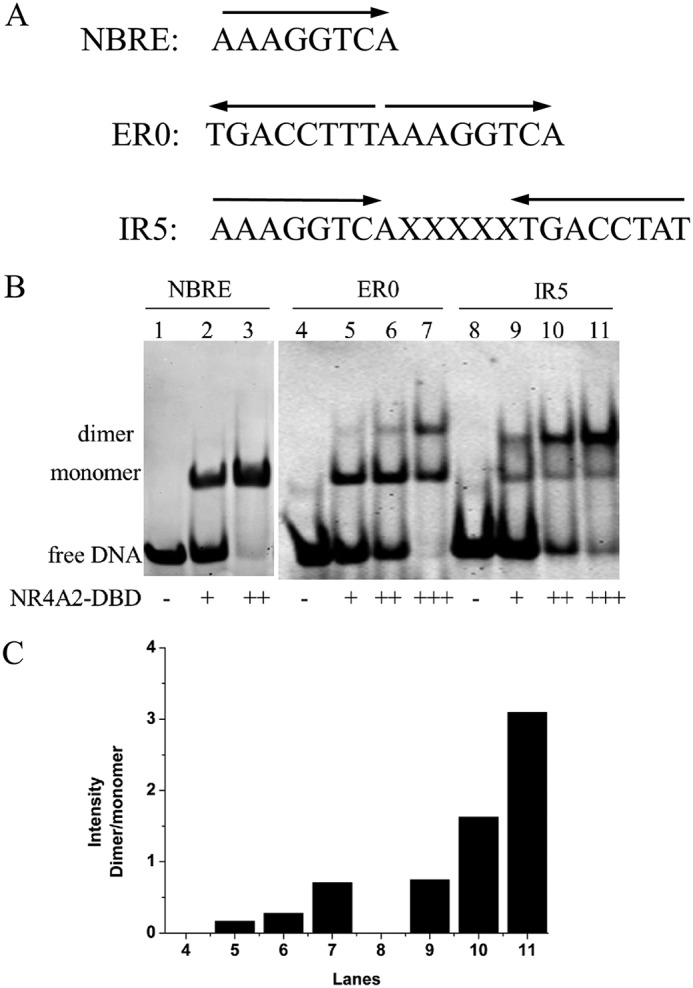
Figure 1.

Binding ability of NR4A2-DBD with different DNAs. A, DNA sequences of the response elements for NR4A2. B, binding features of NR4A2-DBD with different DNAs were determined by EMSA. Lanes 1, 4, and 8 show free DNA without protein. The primary concentrations of DNA and protein used were both 45 μm. + indicates that the molar ratio of protein to DNA is 1:1, and ++ indicates that the molar ratio is 2:1. C, quantification of the intensity of dimer/monomer bands. The graph shows the relative density of the dimer/monomer bands detected by EMSA.
