Figure 2.
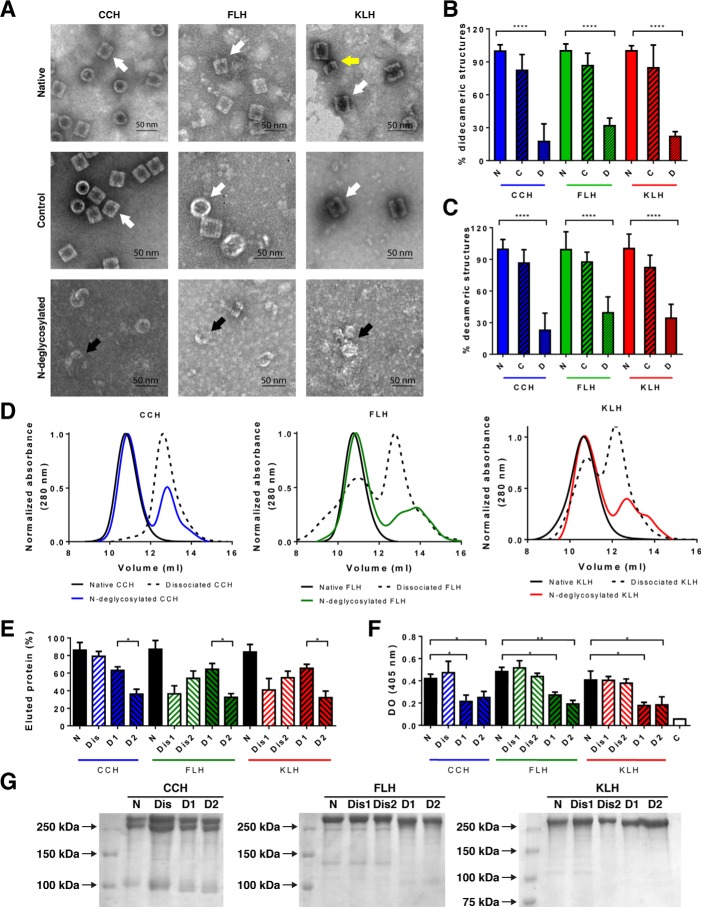
N-Glycans helped maintain the hemocyanin quaternary structure. A, analysis by TEM of CCH, FLH, and KLH. Negative staining of native and N-deglycosylated hemocyanins and a control condition where hemocyanins underwent the N-deglycosylation protocol without the addition of PNGase F is shown. Representative images (lateral, rectangles; axial; circles; views of the hemocyanin molecules available on the grid) of two independent experiments of each hemocyanin at ×60,000, in which didecamers (white arrows), decamers (yellow arrow), and dissociated structures (black arrows) are observed. Scale bar: 50 nm. B, quantification of didecameric structures. 20 different photographs were quantified, where the didecamers of native hemocyanins were considered as 100%. C, quantification of decameric structures. A procedure similar to B was used. Statistical analysis by t test, comparing native versus N-deglycosylated hemocyanins. ****, p < 0.0001. D, size-exclusion chromatography of native, dissociated, and N-deglycosylated hemocyanins performed with a TSKgel® G5000PWXL column at 0.6 ml/min. Eluted proteins were monitored at 280 nm. Black lines are native hemocyanins; dashed lines are dissociated hemocyanins; and colored lines are N-deglycosylated hemocyanins. E, quantitative analysis of chromatographic peaks observed in D. The percentage of each species in the chromatograms was estimated according to the area of each peak using the molar extinction coefficient of 1.4 for CCH and 2.02 for FLH and KLH. Results from the first and the second dissociated peaks are indicated as 1 and 2 (Dis1 and Dis2), respectively. Similarly, N-deglycosylated peaks are indicated as 1 and 2 (D1 and D2), according to the first and the second peak. F, characterization of fractions by its N-glycan content. Eluted fractions from D were analyzed in ELISA plates by lectin staining (ConA plus avidin–FAL and pNPP). Plate optical density was read at 405 nm. Statistical analysis by t test, comparing native versus N-deglycosylated hemocyanins. *, p < 0.05; **, p < 0.01. G, SDS-PAGE analyses. Fractions eluted from D were analyzed. Representative gradient acrylamide gels (5–15%) were stained with Coomassie Blue. Molecular mass standards are indicated on the left. Data are representative of three experiments.

