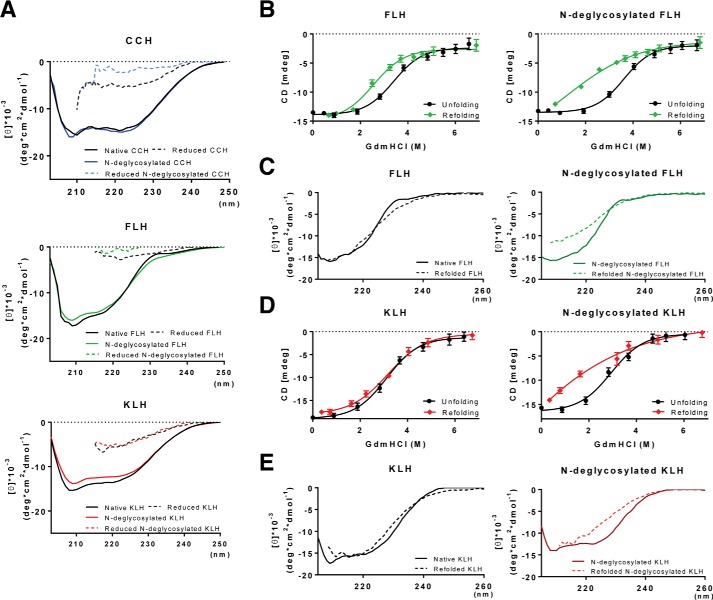
Figure 3.
N-Deglycosylation did not modify the hemocyanin secondary structure but impaired hemocyanin refolding. A, CD analyses. Native and N-deglycosylated hemocyanins in PBS or reducing conditions (2% β-mercaptoethanol) were analyzed by CD in the far-UV region (200–260 nm). B, unfolding and refolding curves of FLH. For the unfolding curves, native and N-deglycosylated FLH were treated with increasing concentrations (0–6.7 m) of GdmHCl for 24 h at room temperature. Similarly, for the refolding curves, samples previously treated with 6.7 m GdmHCl were diluted in PBS. Data are shown as the mean ± S.E. of at least 10 measurements of the dichroism signal at 222 nm from two independent experiments. C, comparison between the unfolded and refolded spectra of native and N-deglycosylated FLH. D, unfolding and refolding curves of KLH. Spectra of samples were obtained as described in B. E, comparison between the unfolded and refolded spectra of native and N-deglycosylated KLH. For all experiments, hemocyanins were analyzed at 0.25 mg/ml at 25 °C in a J-1500 JASCO spectropolarimeter. The CD spectra represent the average value of three measurements. In this case, the standard error is less than 10% for each wavelength determined. B and C, errors bars correspond to the variability of the CD signal observed during 30 s in two independent experiments.

