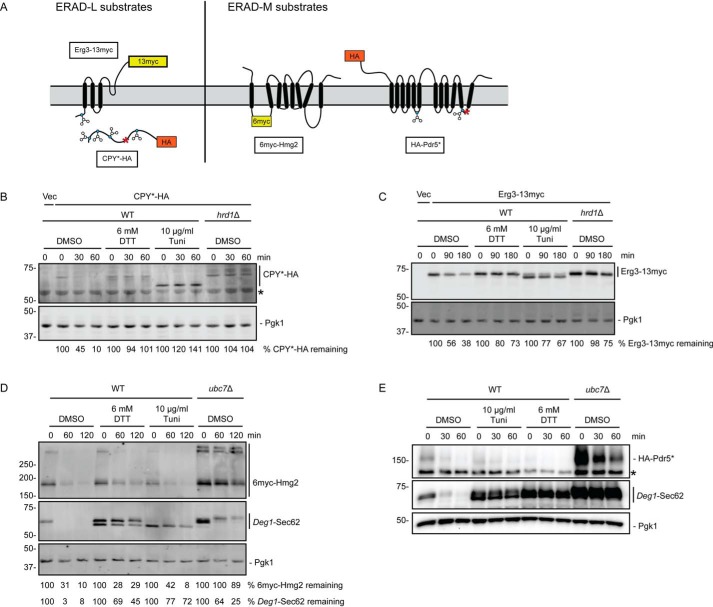
Figure 2.
ER stress impairs degradation of Hrd1 ERAD-L substrates but not Hrd1 ERAD-M substrates. A, schematic of Hrd1 substrates investigated in this figure. Blue circles represent glycosylated amino acids. Red asterisks indicate destabilizing point mutations. B–E, cycloheximide chase analysis of yeast of the indicated genotypes harboring an empty vector (Vec) or expressing CPY*-HA (B), Erg3-13myc (C), 6myc-Hmg2 (D), or HA-Pdr5* (E) cultured in the presence of 6 mm DTT, 10 μg/ml tunicamycin, or DMSO for 1 h. DTT, tunicamycin, and DMSO were maintained at the same concentration during incubation with cycloheximide. Asterisks in B and E denote nonspecific bands. Cells analyzed in D and E also expressed Deg1-Sec62 as a control for ER stress induction. CPY*-HA and Pdr5*-HA were detected with anti-HA antibodies. Erg3-13myc and 6myc-Hmg2 were detected with anti-Myc antibodies. Deg1-Sec62 was detected with AlexaFluor-680–conjugated rabbit anti-mouse antibodies (D) or peroxidase anti-peroxidase antibodies (E). Pgk1 served as a loading control. Where indicated, the percentage of substrate remaining (normalized to Pgk1) at each time point is presented below the image. We note that, relative to other experiments, Deg1-Sec62 exhibited weaker stabilization in the absence of UBC7 in the cycloheximide chase presented in D; this may be related to differences in genetic background in the strains analyzed. Experiments depicted in B–D were performed three times. The experiment depicted in E was performed two times.

