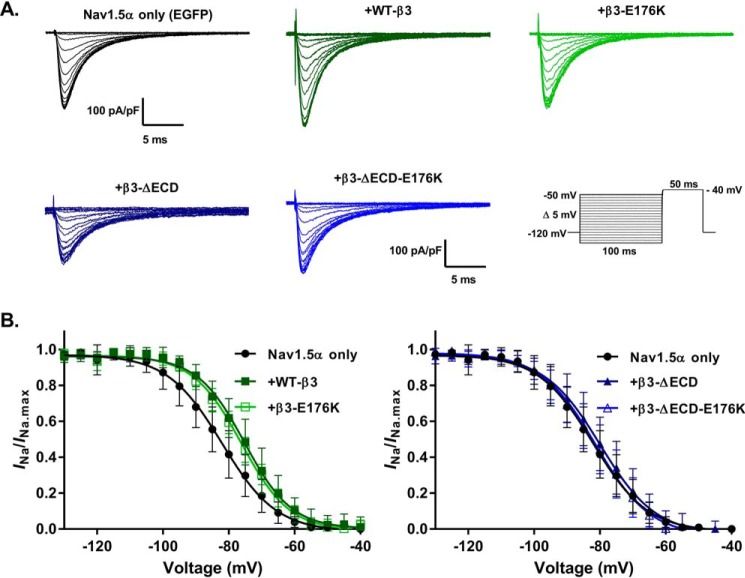
Figure 4.
Effects of the β3-subunit on Nav1.5 steady-state inactivation are mediated through the ECD. A, representative whole-cell Na+ currents in response to a steady-state inactivation protocol (inset). B, peak INa from each sweep normalized to the maximum peak INa (INa/INa.max) of all sweeps and plotted as a function of the pre-pulse voltage step. The data are means ± S.D. (n ≥ 10, see Table 1 for individual values) and are separated by Nav1.5 + EGFP, WT-β3-EGFP, and β3-E176K-EGFP in the left panel and Nav1.5 + EGFP, ΔECD-β3-EGFP, and ΔECD-β3-E176K-EGFP in the right panel. The Nav1.5 + EGFP is the same in both graphs; the separation is for clarity. The curves are fit to Boltzmann functions (see “Experimental procedures”). The statistical significance of the V½ and k values produced were determined using one-way ANOVA (both V½ and k; p < 0.01) followed by a Sidak's multiple comparison post hoc test (all conditions were compared against Nav1.5 + EGFP and Nav1.5 + β3-EGFP). V½ of Nav1.5 steady-state inactivation is positively shifted by the full-length β3 and the β3 with the single transmembrane E176K point mutation (Nav1.5 + EGFP versus WT-β3, p = 0.0026; and Nav1.5 + EGFP versus β3-E176K-EGFP, p = 0.0263). Removal of the Ig-like ECD abolishes these shifts (Nav1.5 + EGFP versus β3-ΔECD-EGFP, p = 0.865; and Nav1.5 + EGFP versus β3-ΔECD-E176K-EGFP, p = 0.99). See Table 1 for all comparisons.

