Figure 1.
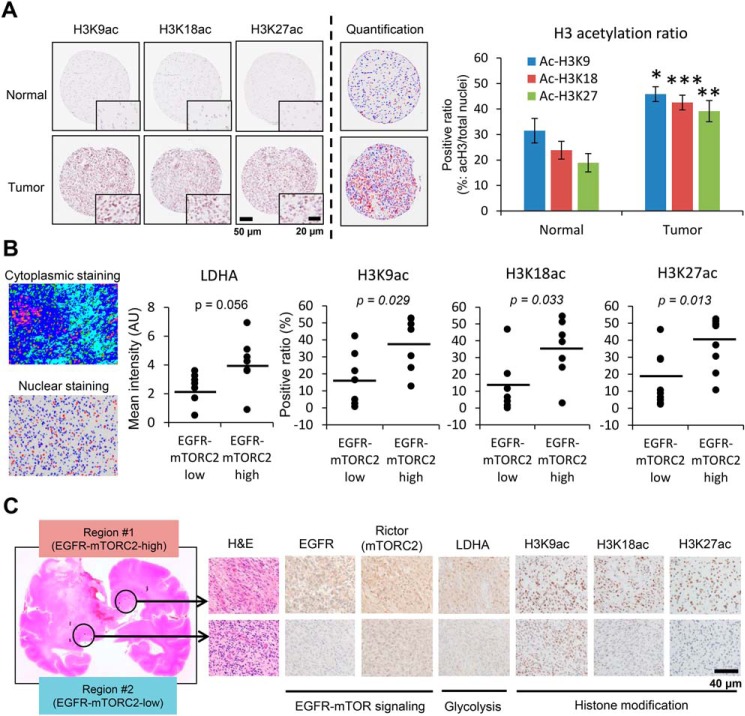
EGFR-mTORC2 signaling correlates with histone acetylation in human GBM. A, histone H3K9, K18, and K27 acetylation immunostaining of GBM tissue (15 normal brain tissue and 17 GBM tissue). A bar graph showing the positive ratio of each histone mark (acetylated histone H3 (red)/total nuclei (red + blue)). Scale bars, 50 μm (20 μm for insets). B, quantitative immunohistochemical analysis of LDHA (a glycolytic enzyme) and histone H3 acetylation (K9ac, K18ac, and K27ac), based on low and high expression regions in EGFR-mTORC2 signaling, obtained at autopsy from 7 patients with GBM or surgically resected 10 GBM tissue. The averaged mean saturation of Rictor for the mTORC2-low group is 5.39, and the mTORC2-high group is 8.83. Also shown are representative images of immunohistochemical quantification: cytoplasmic staining with Visiopharm and nuclear staining with ImageJ. AU, arbitrary unit. C, representative images for differential expression in EGFR-mTOR signaling, glycolytic metabolism and histone acetylation in autopsied GBM samples. Scale bar, 40 μm.

