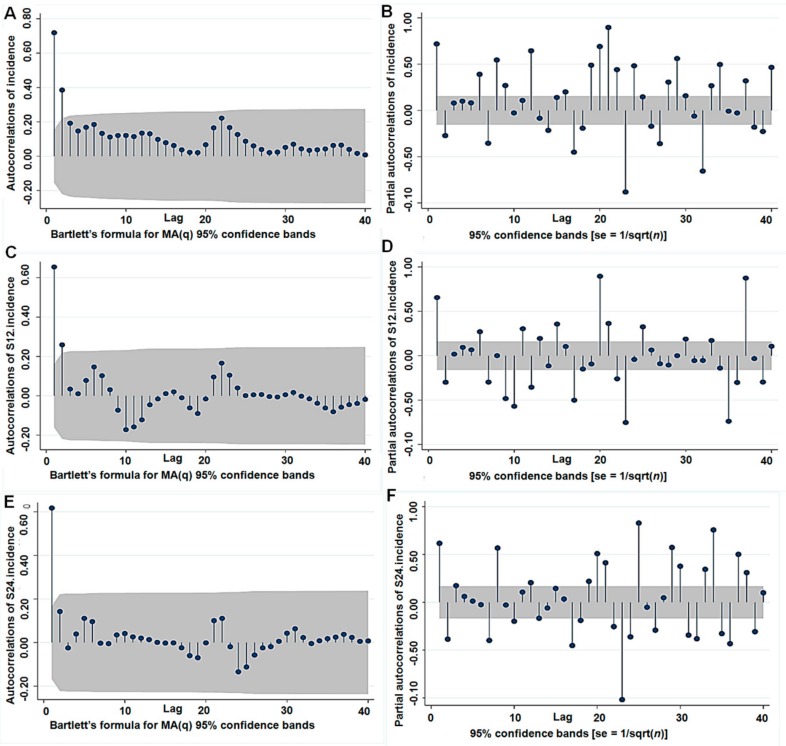
Figure 3.
The ACF and PACF graphs for estimating the parameter: (A) The ACF graph of the raw data (d = 0 and D = 0), (B) the PACF graph of the raw data (d = 0 and D = 0), (C) the ACF graph of one-order seasonal difference data (d = 0 and D = 1), (D) the PACF graph of one-order seasonal difference data (d = 0 and D = 1), (E) the ACF graph of two-order seasonal difference data (d = 0 and D = 2), and (F) the PACF graph of two-order seasonal difference data (d = 0 and D = 2).

