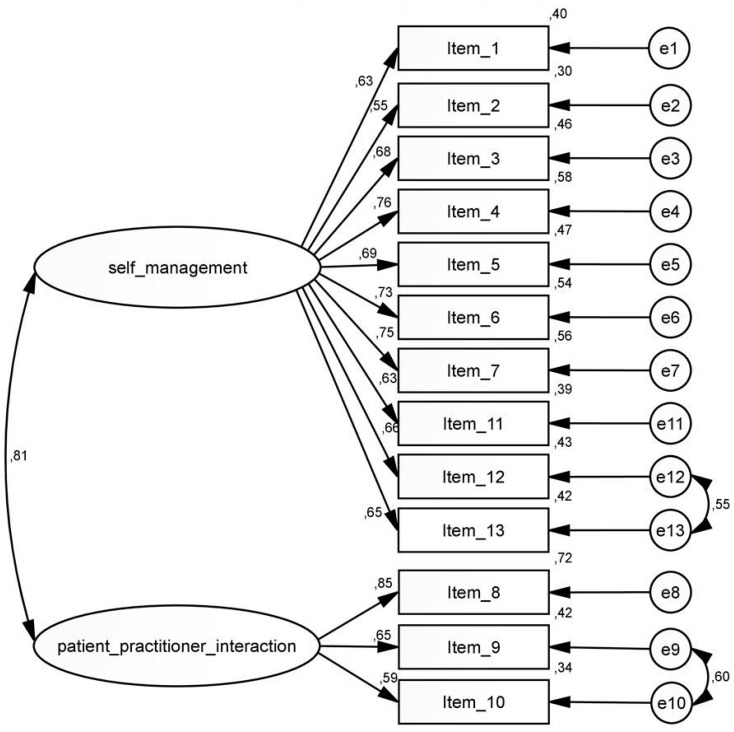
Figure 3.
Path model for the CFA of the German PEN-13 and the corresponding path coefficients. Explication of Figure 3: The values between the factor and the item are the corresponding path coefficients; the values in the right column (0.40; 0.30; 0.46; …) are the path coefficients with the error terms.

