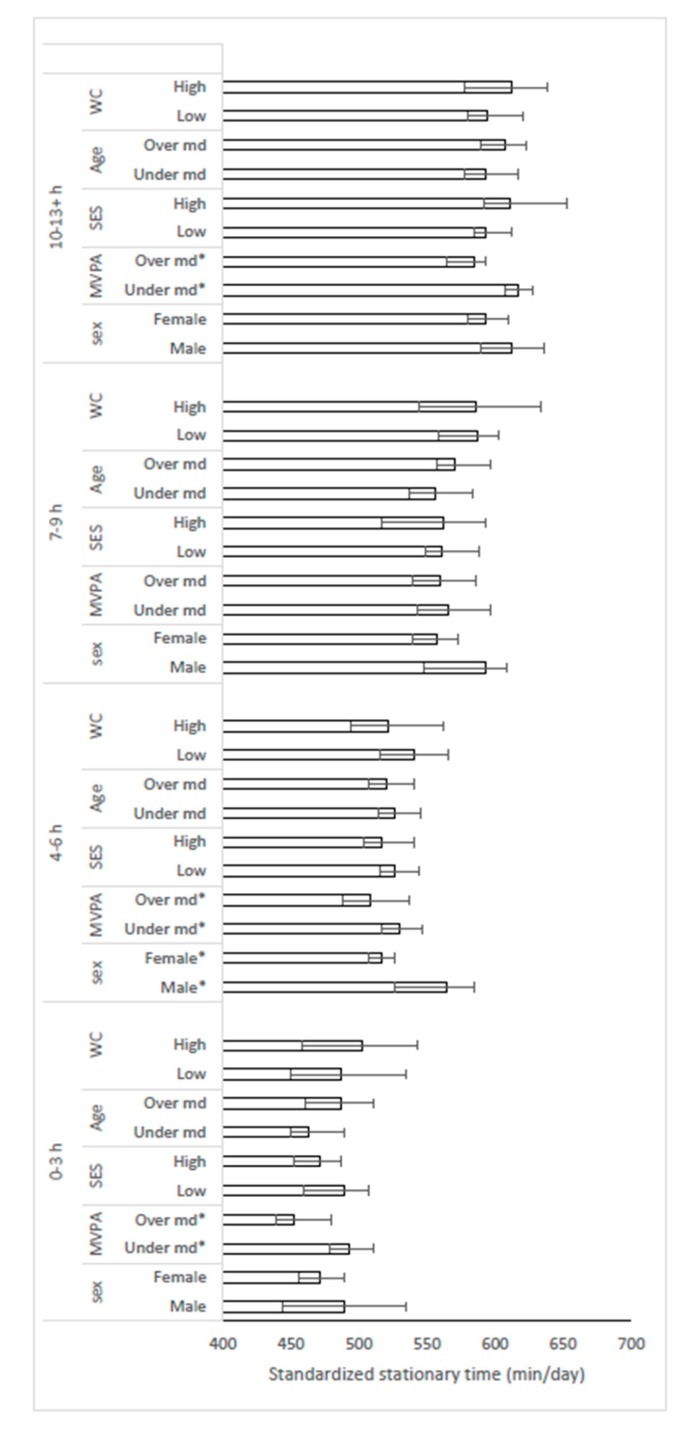
Figure 3.
Comparison of mean (95% CI) device-assessed stationary time between selected strata across the response categories. The two upper categories were merged due to low number (n = 16) in the 13+ h category. Stationary time was different between MVPA strata in three of four response categories. * = significant difference between strata. MVPA: moderate to vigorous physical activity; SES: education; WC: waist circumference; md: median.

