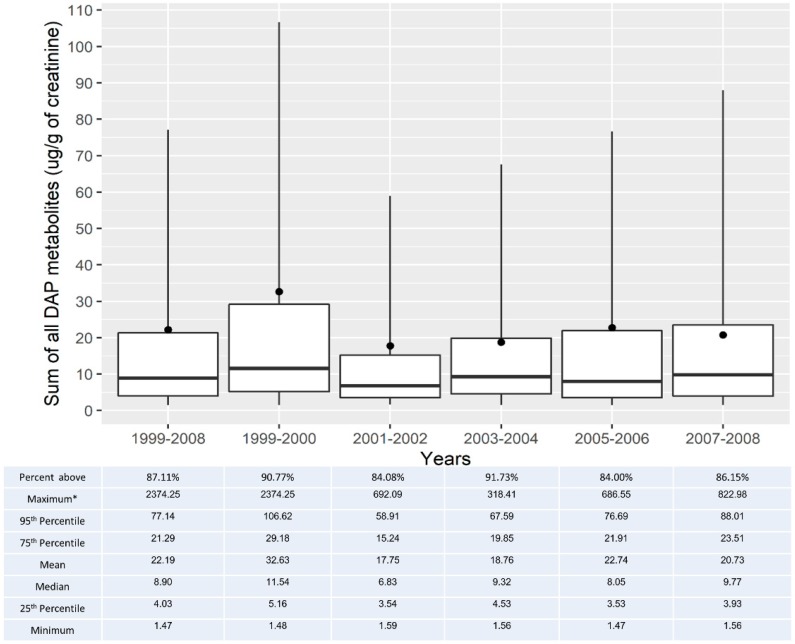
Figure 1.
Time trends in the sum of all urinary DAP metabolites in adults from 1999 to 2008 with at least one DAP metabolite at or above the DL. Notes: Boxplots represent the minimum, first quartile, median, third quartile, and 95th percentile values. Mean values are represented by the black circle. * Indicates value not depicted in the figure.

