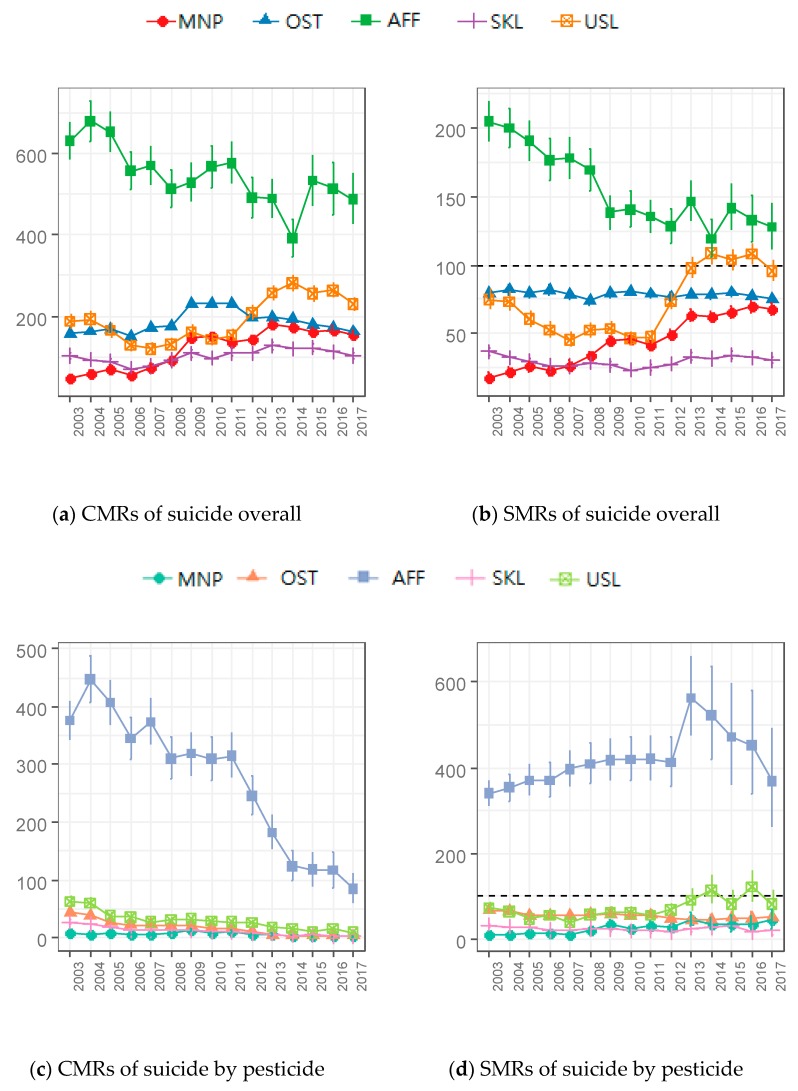
Figure 3.
Time trends of suicide and suicide by pesticide rates by occupational groups among workers aged 15–64. The first row represents suicide overall and the second row represents suicide by pesticide. The left column shows the crude mortality rates (CMRs) and the right one shows the standardized mortality ratios (SMRs). MNP: Manager and professional, OST: Officer, service, and trade, AFF: Agriculture, forestry, and fishery, SKL: Skilled manual labor, USL: Unskilled manual labor. (a) CMRs of suicide overall. (b) SMRs of suicide overall. (c) CMRs of suicide by pesticide. (d) SMRs of suicide by pesticide.

