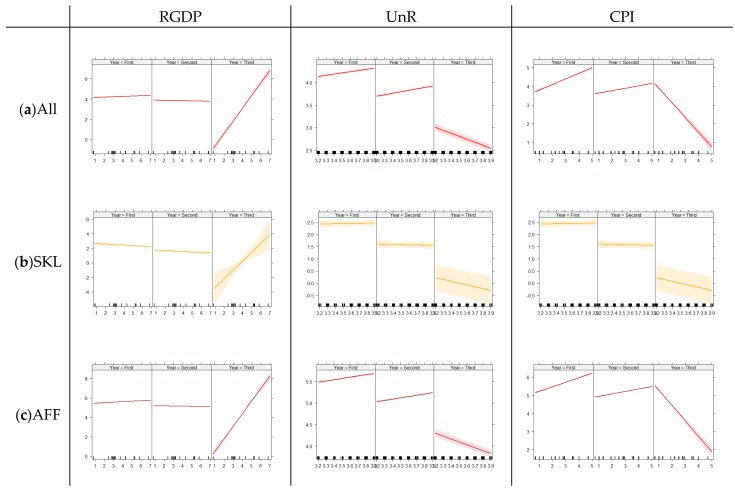
Figure 5.
Summary of the general linear regression models for suicide by pesticide by economic indicators. Each model shows each occupational group divided by each five-year period (2003–2007, 2008–2012, and 2013–2017). RGDP: real gross domestic product. UnR: unemployment rate. CPI: rate of customer price index. (a) Suicide by pesticide for all occupational groups. (b) Suicide by pesticide for the skillful manual labor group. (c) Suicide by pesticide for agriculture, forestry, and fishery.

