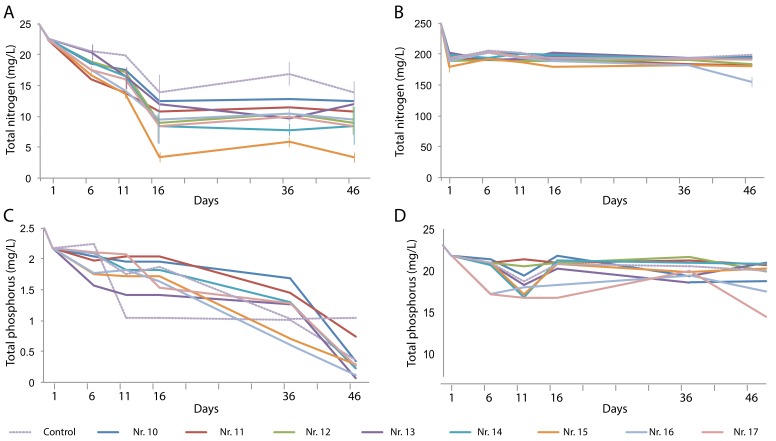
Figure 4.
Changes over time in total N (A,B) and total P (C,D) content in artificial domestic sewage water (A,C) and artificial animal farm wastewater (B,D) in the presence of various plant species and their combinations. Plant species are the same as those in Figure 3.

