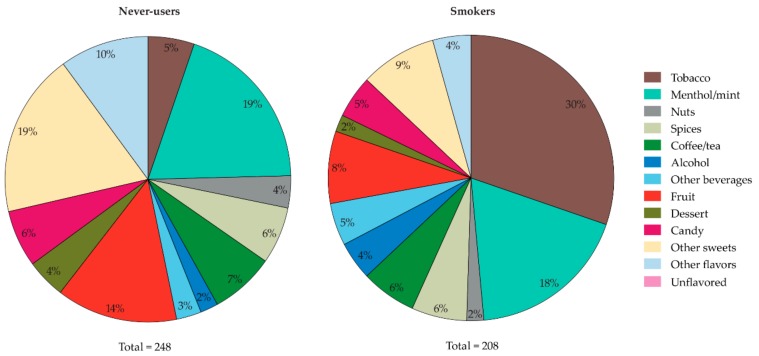
Figure 1.
Interest in trying e-liquid flavors among never-users (left) and smokers (right). Never-users (n= 278; 68%) and smokers (n = 27; 20%) who selected the option “none of the flavors” were excluded from this visualization, and hence the pie charts visualize 248 responses from 32% of the never-users and 208 responses from 80% of the smokers. Data are presented as percentages of the total number of responses, not of the total sample sizes.

