Figure 1.
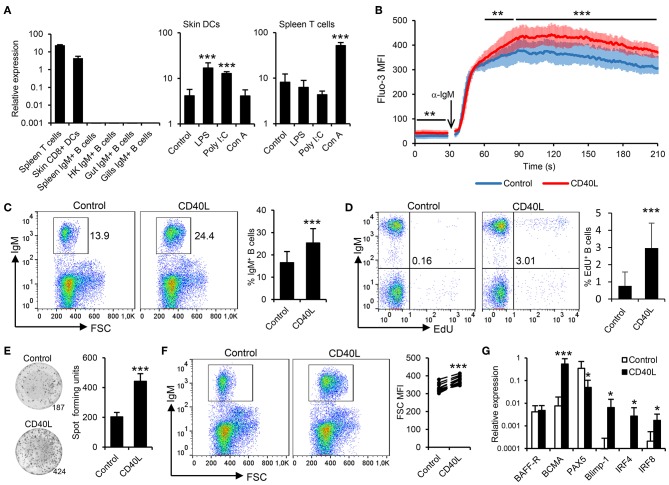
Trout IgM+ B cells are highly responsive to CD40L. (A) CD40L transcription levels were analyzed through real-time PCR in rainbow trout FACS-isolated leukocyte subsets. In some cases, cells were previously incubated for 18 h with lipopolysaccharide (LPS), poly I:C, concanavalin A (ConA), or with media alone (control). The relative expression to the endogenous control EF-1α was calculated and is shown as mean + SD (n = 6). Spleen leukocytes (n = 12) were incubated with CD40L (5 μg/ml) or control media alone at 20°C and diverse assays performed at different times poststimulation. (B) After 48 h, calcium flux was assayed upon BCR stimulation. Data are represented as mean fluorescence intensity (MFI) (solid line) ± SD (shaded areas) of intracellular Ca2+ levels in IgM+ B cells. (C) After 72 h, the percentage of live IgM+ B cells among the lymphocyte gate was determined. Representative dot plot and mean IgM+ B cell survival + SD are shown. (D) After 72 h, cells were labeled with EdU and incubated for a further 24 h. The percentage of proliferating (EdU+) IgM+ B cells were then determined. Representative dot plot and mean percentage of proliferating B cells within the IgM+ compartment + SD are shown. (E) After 72 h, an ELISPOT was conducted. Representative wells and quantification of spot forming cells are shown as mean + SD. (F) The size of the IgM+ B cell population was also measured after 72 h and calculated as MFI of FSC. Representative dot plot and MFI of FSC for each individual fish are shown. (G) After 24 h, IgM+ B cells were FACS isolated and RNA extracted to determine the transcription of specific genes relative to EF-1α. Results are shown as mean relative expression + SD. In all experiments, statistical differences were evaluated by a one-way ANOVA followed by a two-tailed Student's t-test, where *p ≤ 0.05, **p ≤ 0.01, and ***p ≤ 0.005.

