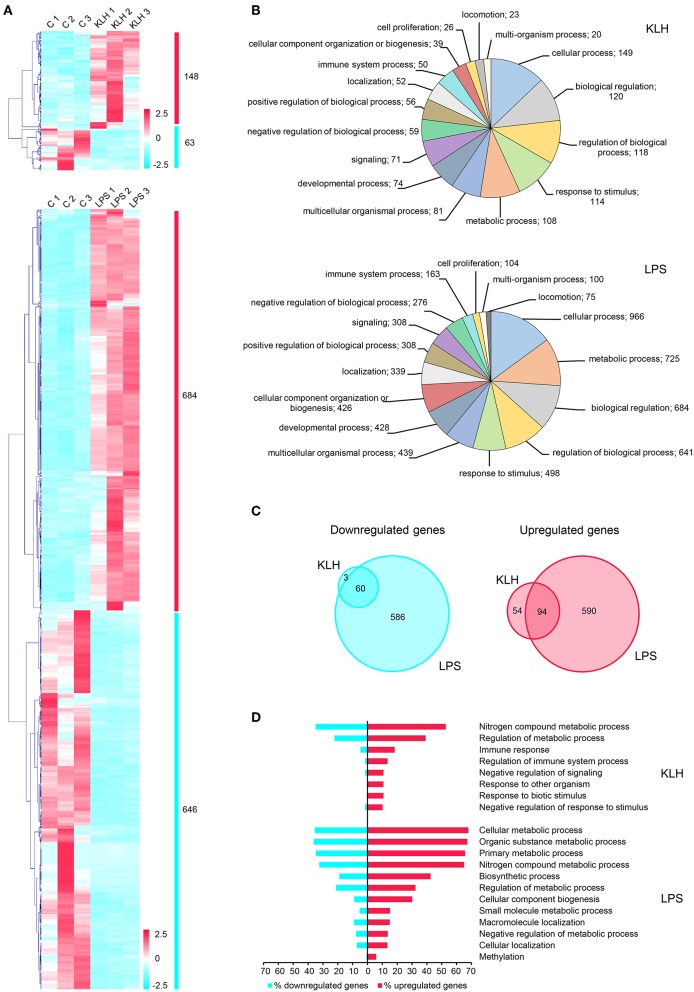
Figure 4.
Global analysis of differentially expressed genes in TNP-LPS and TNP-KLH stimulated B cells. (A) Clustering analysis of differentially expressed genes in TNP-LPS and TNP-KLH stimulated IgM+ B cells. Genes were row normalized and hierarchical clustering constructed using Pearson correlation and the average linkage clustering method. (B) Pie chart showing the number of differentially expressed genes in TPN-KLH or TNP-LPS annotated with different Gene Ontology (GO) terms at level 2 of biological process category. (C) Venn diagram showing the number of upregulated and downregulated genes for each treatment. Intersections show the number of differentially expressed genes shared between both stimulations. (D) Single enrichment analysis between upregulated and downregulated genes for each treatment. Bars show the percentage of genes identified for each GO term at level 3 from biological process category, which showed a significant enrichment (p < 0.05) in upregulated genes.

