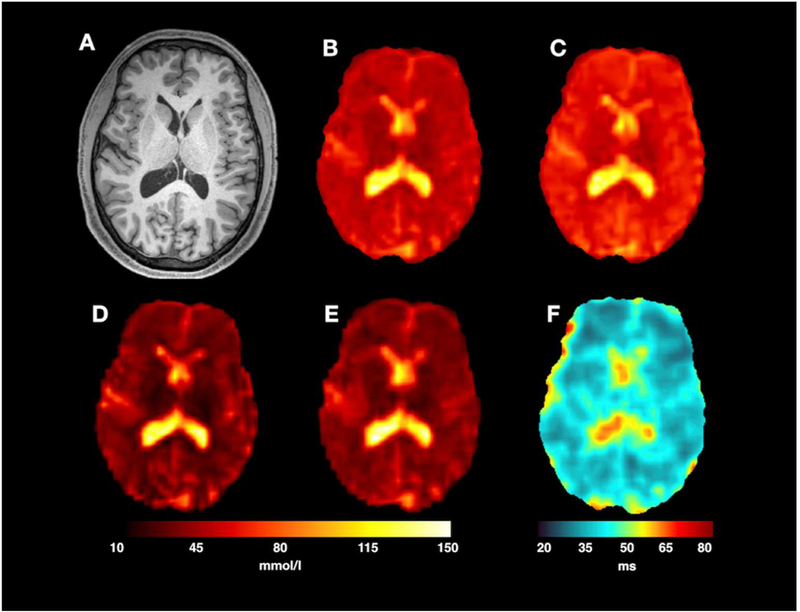
Fig. 6.
Images from a single subject scanning session. A standard MPRAGE image (A) was used to acquire the brain anatomy. Two T1-weighted 23$Na SPGR acquisitions with FA 25° (B) and 55° (C) (TA of 9 min each) formed the basis for the VFA acquisition. For SNR comparison, images (B) and (C) are shown with the same intensity scaling. TSC map resulting from the SD and the VFA methods are shown in (D) and (E), respectively. For a fair comparison, the acquisition time, TA, for the SD method was set to 18 min. The T1 map resulting from the VFA method is shown in (F). Calibration tubes were masked for results display.

