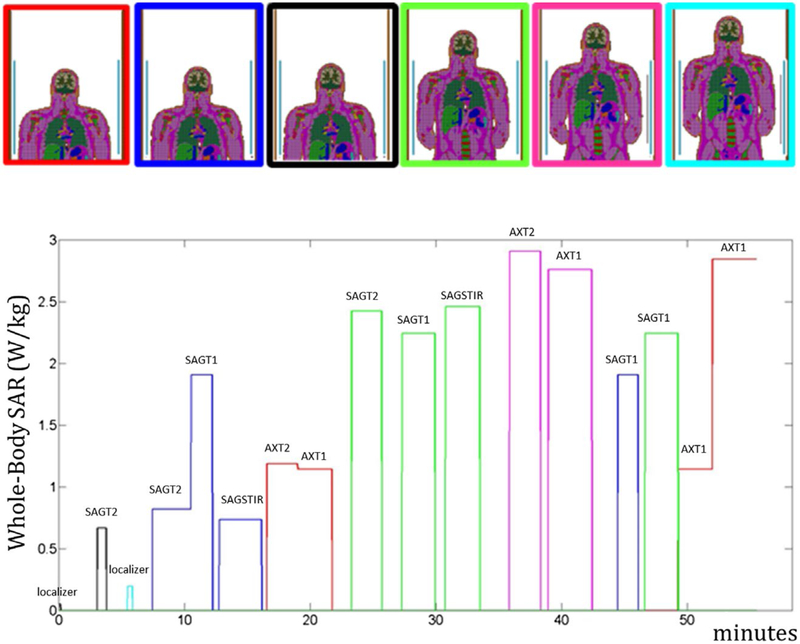
FIGURE 1.
Simulated position of the body in the coil (6 different patient table positions) and whole-body SAR levels recorded during the MRI exam. The position of the body during the exam is identified by matching the color of the border in the upper image with the line color in the whole-body SAR plot. The purpose of each sequence is briefly indicated above it

