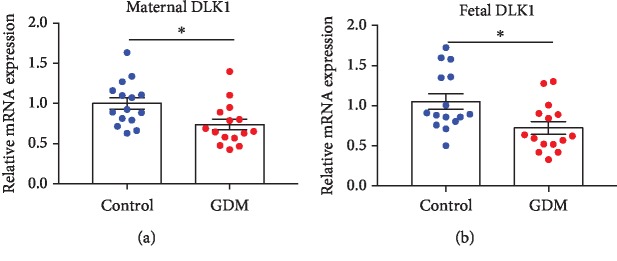
Figure 1.
The mRNA expression of DLK1 in both maternal and fetal sides of the placenta. (a) DLK1 expression in the maternal side of the placenta. (b) DLK1 expression in the fetal side of the placenta. RNA levels determined by RT-PCR. Data were analyzed with the Eq. 2-△△CT, where △△CT = △CT (treatment group)‐△CT (control group) and △CT = △CT (sample)‐△CT (internal control). The values were normalized to GAPDH mRNA levels. Control group has 15 samples, and GDM group has 15 samples. In all panels, data are presented as mean ± SE, ∗P < 0.05, and ∗∗P < 0.01. Significance was determined by Student's t-test.

