
Figure 2.
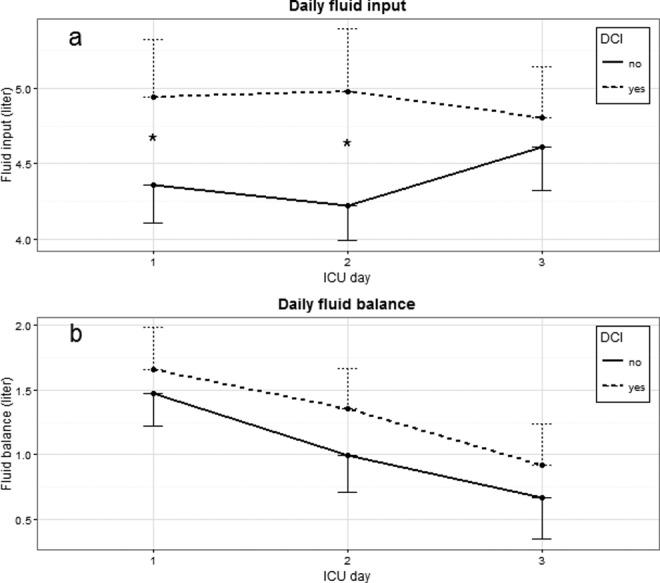
Daily fluid parameters in cohort 1. Data are represented as mean with 95% CI as 1-sided error bar. Differences between patients with and without DCI are indicated in figures: *P < .01. ICU, intensive care unit; DCI, delayed cerebral ischemia; CI, confidence interval.