
Fig. 5.
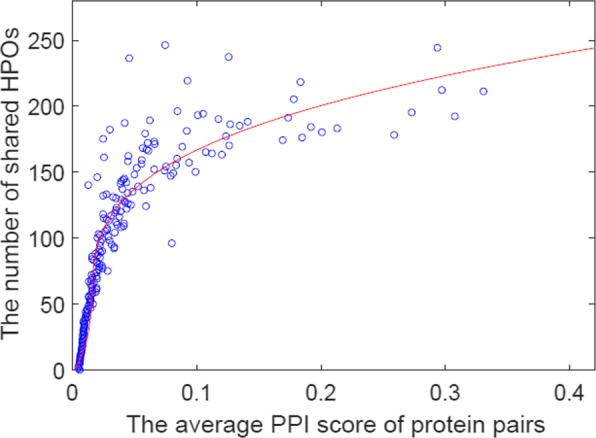
Each circle is a pair of two proteins in STRING PPN, with sharing the same numbers of HPO terms, say K. The x-axis is the average similarity score between two proteins over those HPO terms sharing the same K, and the y-axis is K, i.e., the number of shared HPO terms. The red line shows the trend, which is fitted by a polynomial function with the maximum degree of three