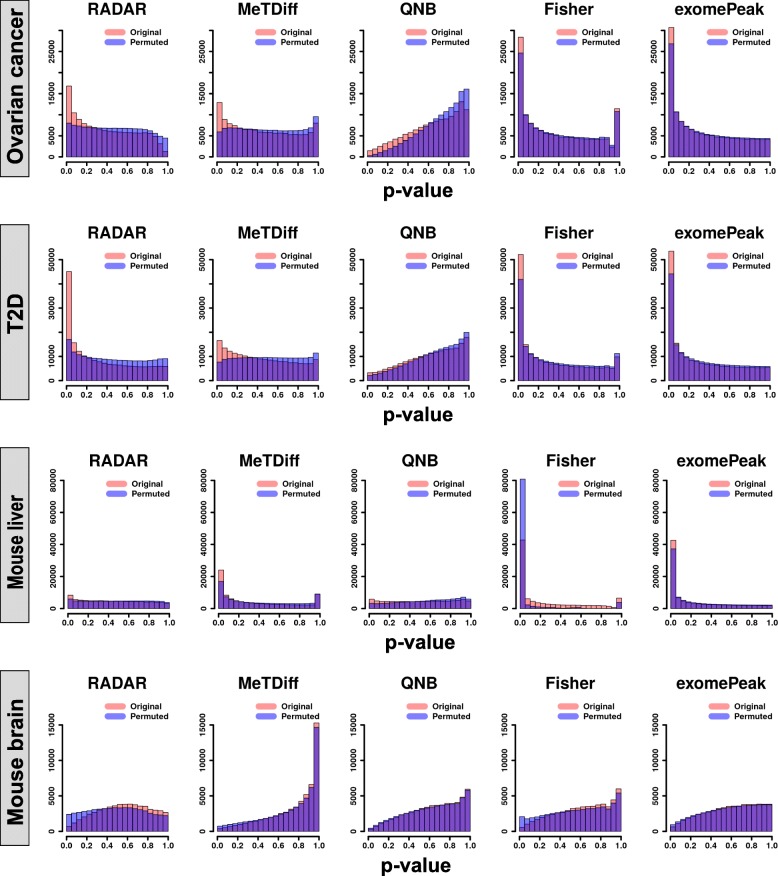
Fig. 4.
Benchmarking false-positive signals using permutation analysis on real m6A-seq data. To assess empirical FDR of the test, we permuted the phenotype labels of samples so that the new labels were not associated with true ones. Each panel shows the histograms of p values obtained from DM tests on 15 permuted copies (blue) and those from the tests on the original dataset (red)

