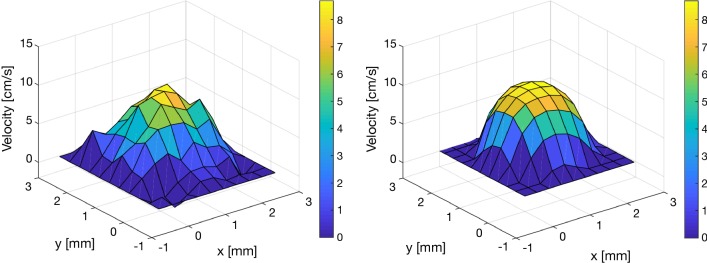
Fig. 3.
Comparison of PCMRI (left) and CFD velocity profiles (right) at maximum CA outflow in an example subject. The maximum spatial velocity for the group was 11.1 5.3 cm/s for the PCMRI measurements and 11.5 6.9 cm/s for the CFD simulations (mean difference: − 0.4 4.4 cm/s, PCMRI-CFD). Generally, the largest differences were found for small aqueducts or aqueducts with the highest SV. The small difference could be partly attributed to the difference in spatial resolution between the PCMRI data and the CFD meshes (CFD had higher resolution). In this figure, the CFD data has been down-sampled spatially in order to simplify the visual comparison

