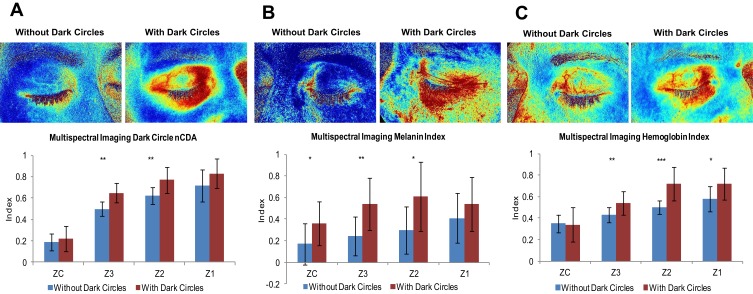
Figure 3.
Multispectral analysis of the infraorbital zones including example images of (A) overall dark circle, (B) melanin, and (C) haemoglobin. (N =12 with dark circles versus N=12 without dark circles, *p<0.05, **p<0.01, ***p<0.001).
Abbreviations: Z1, Zone 1; Z2, Zone 2; Z3, Zone 3; ZC, Cheek Control Zone; nCDA, normalized canonical discriminant analysis.

