Figure 1.

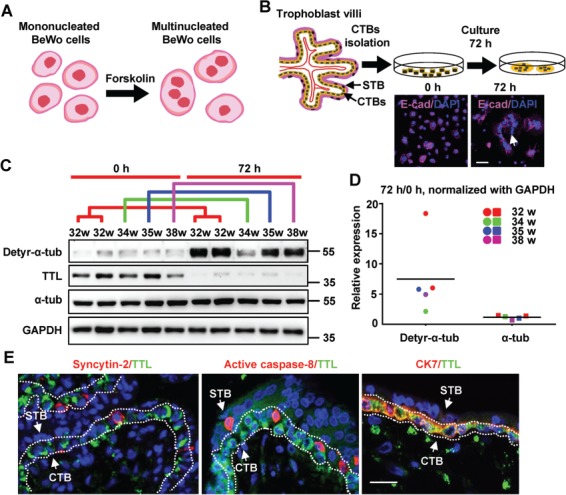
Augmented detyrosination of α-tubulin during spontaneous fusion of primary CTBs. (A) Illustrative model depicting BeWo cell fusion. (B) Upper panel: schematic illustration of spontaneous syncytialization of human primary CTBs after isolation. Lower panel: human trophoblasts stained at 0 and 72 h of culture for E-cadherin and nuclei. Scale bar, 50 μm. (C) Results of western blotting using the indicated antibodies on primary CTBs from the indicated gestational ages and their corresponding syncytia after 72 h of incubation. GAPDH was used as a loading control (here and hereafter). The colored lines represent groups of corresponding gestational ages. (D) Quantification of the western blot data in C. The band intensities detected with anti-α-tubulin and anti-detyr-α-tub antibodies were normalized to that of GAPDH as a control. The dots and squares representing individual samples from patients are colored according to the matching samples at different time points. The horizontal lines represent the means. (E) For confocal microscopy, Alexa Fluor 488 (green) was used to label TTL. Alexa Fluor 555 (red) was used to label Syncytin-2, active caspase-8, or CK7. Scale bar, 10 μm. The arrows indicate a layer of mononucleated CTBs and a layer of multinucleated STB.
