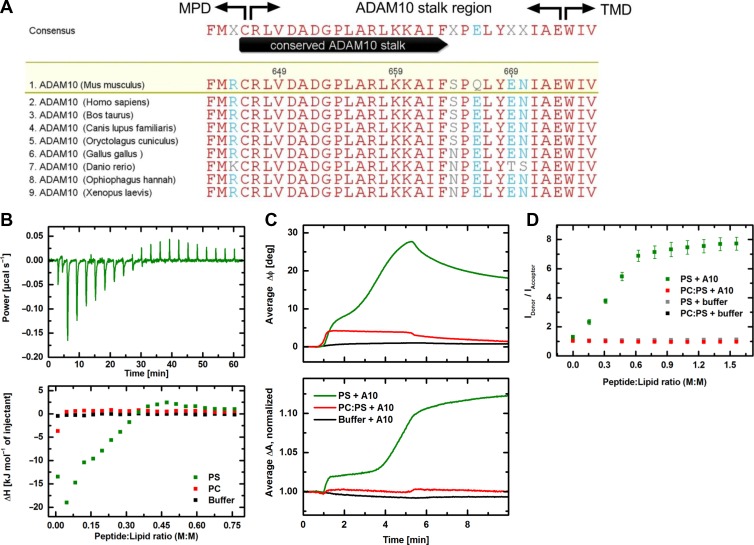
Figure 6.
Biophysical properties of the ADAM10 stalk region. (A) Alignment of the ADAM10 stalk region sequences downstream of the membrane proximal domain (MPD) and upstream of the transmembrane domain (TMD) from different species identifies a highly conserved region. Red letters indicate identical residues. ClustalW multiple sequence alignment. (B) ITC measurements to study the interaction of the ADAM10 stalk region with either PS (green) or PC (red) liposomes. Shown is the heating power corresponding to interaction of the ADAM10 peptide with PS liposomes in 20 titration steps as a function of time (upper panel) and the interaction enthalpy for both lipid systems and the buffer control (black) plotted over the peptide:lipid ratio (lower panel). While the titration of ADAM10 peptide into buffer and to PC liposomes shows no interaction, it comes first to exothermic reactions and then to endothermic reactions with PS liposomes. (C) SAW measurements showing the interaction of ADAM10 peptide with PS membranes (green) or PC:PS (9:1) membranes (red) immobilized on the CM-dextran/poly-L-lysine (PLL) functionalization of the sensor chip surface. Binding of the peptide to the functionalization (black) served as control. The increase of the phase signal ΔΦ indicates an additional mass loading on the chip surface being more pronounced for PS than for PC:PS (upper panel); the increase of the amplitude signal ΔA corresponds to an increased viscosity on the surface (lower panel). Shown are average curves of five individual sensor channels. (D) Fluorescence resonance energy transfer (FRET) spectroscopy. Intercalation of ADAM10 peptide into PS liposomes (green) and PC:PS (9:1) liposomes (red). The liposomes are double labelled with NBD-PE (donor) and Rhodamine-DHPE (acceptor). An increased ratio between donor and acceptor fluorescence intensities indicates insertion of peptides between the lipid molecules. This effect is only visible for PS liposomes but not for PC:PS liposomes. Controls (grey and black) show no effect. Error bars indicate the standard deviations of three independent measurements.

