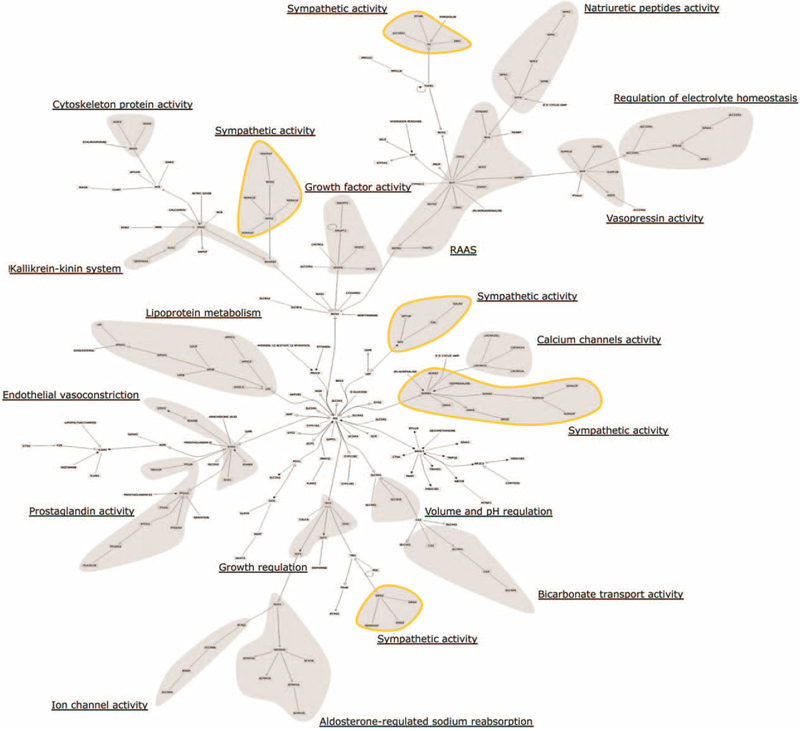
FIGURE 2.
Hypertension gene list tree-like map indicating subsystem functional annotations. Shaded areas are regions with a high representation of various pathways and systems affecting blood-pressure regulation (the sympathetic activity components, marked by a yellow border, appear in five regions of the map, the other modules are unique). Annotation was performed manually based on gene ontology annotations and uniprot gene descriptions (see Functional Classification section and Table S2 in Supplemental Digital Content for functional assignments, http://links.lww.com/HJH/A894).

