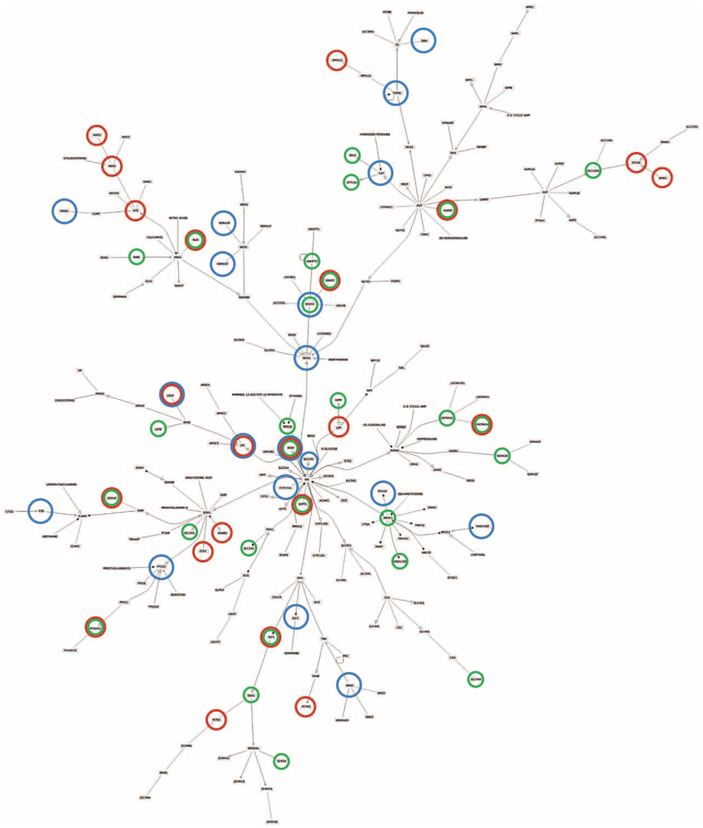
FIGURE 4.

Hypertension network regulation. Tree-like representation of the hypertension protein interaction map, showing genes controlled by specific regulators. Circled genes are regulated by enriched elements: Blue – SP1 transcription factor, Green – microRNA548c, Red – microRNA27 (detailed target list in Supplemental Digital Content Table S6, http://links.lww.com/HJH/A894).
