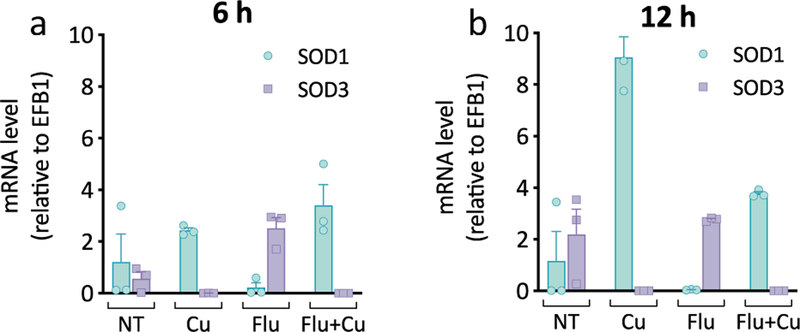
Figure 5. C. albicans switches to Mn-Sod3 during fluconazole treatment.
mRNA levels of SOD1 (blue bars) and SOD3 (purple bars) relative to EFB1 after 6 h (a) and 12 h (b) of growth. Conditions: [Flu] = 10 µM, [CuSO4] = 10 µM in YPD media. Data are reported as mean ± SEM, n = 3 biologically independent samples per group.

