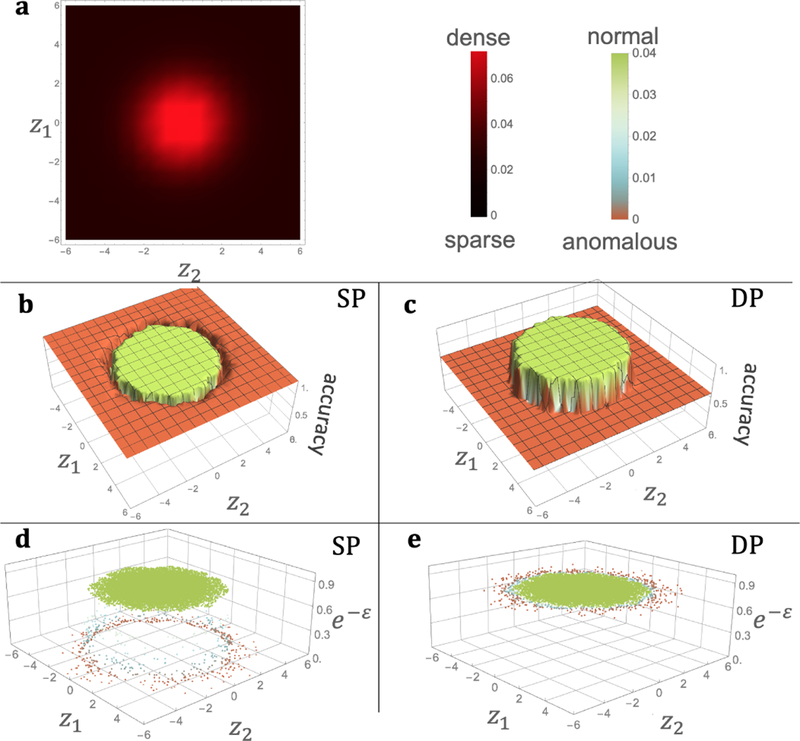
Figure 2:
(b), (c) is for the same data, and (d), (e) is for the same data. (a) gives the density plot of the distribution of the example data. z1 and z2 axes give the coordinate of a point (record). (b) and (c) resp. show the accuracy (on vertical axis) for anomaly identification (AId) via sensitively private (SP) and DP mechanisms for the data. The plots give the interpolated results to clarify the relationship of outlyingness and accuracy. (d) and (e) give the privacy (on vertical axis) for each record in the data for private AId. All the green (normal) points in (d) are at the same level as all the points in (e).

