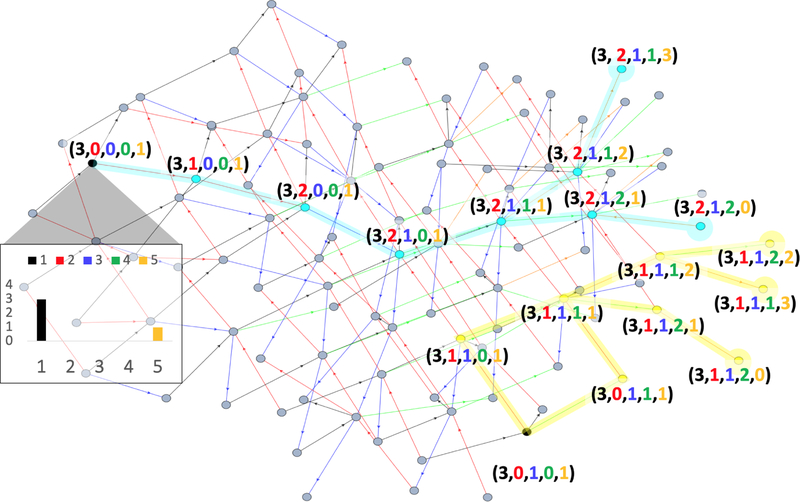
Figure 4:
Sensitive neighborhood graph. A simple example of a 1-sensitive neighborhood graph, GS, with , ℓ1-metric over , and (β = 3, r = 1)-anomaly. Note that GS is an undirected graph; arrowheads indicates the record is added at the end node; the color of the edge corresponds (as per the given color code) to the value of the record added. Further, each database x is represented as a 5-tuple with xi for representing the number of records in x that have value i.

