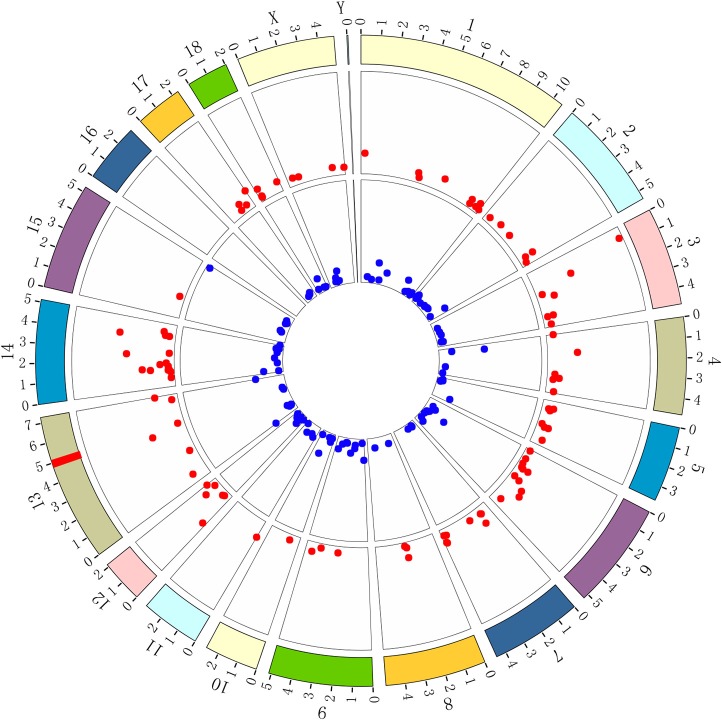
Figure 3.
BioCircos was used to visualize the locations of DEG loci on chromosomes. Red points represent genes expressed at higher levels in adhesive piglets; blue points represent genes expressed at lower levels in adhesive piglets. The red line in the band at 13q41 locates the locus that encodes ETEC F4acR based on previous studies. The distance from location to outer periphery is –log (p-value).

