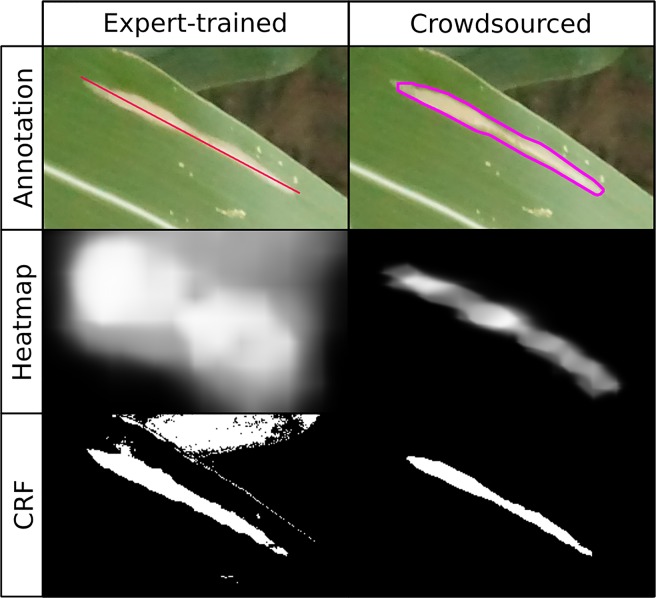
Figure 2.
Comparison of annotations used and results of expert-drawn-lines model (left; Wu et al., 2019) and crowdsourced-polygon model described here (right). Top row: original image with annotations overlaid. Middle row: heatmap created by applying convolutional neural network in sliding window across image, brightness indicating probability of lesion at a given point (white = lesion, black = non-lesion). Bottom row: binary mask output of conditional random field segmentation using original image and heatmap.

