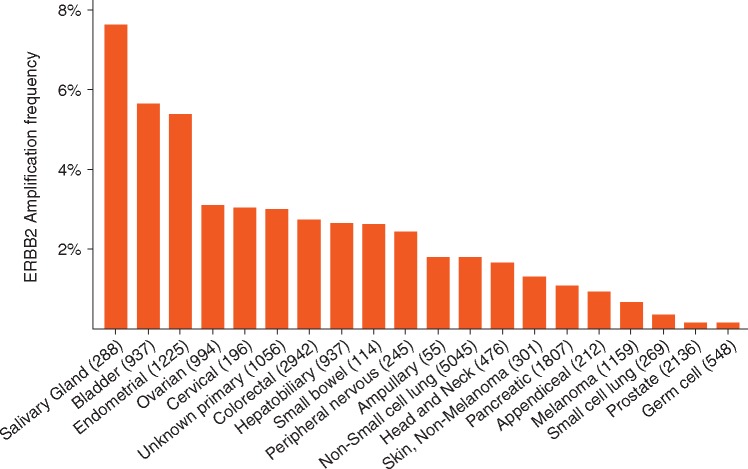
Figure 1.
ERBB2 amplification frequency: all tumors excluding breast and gastric/gastroesophageal junction tumors. This plot includes solid tumors (467/28 106 samples and 442/25 637 patients) with a minimum of 50 sequenced tumors and ERBB2 amplification > 0% using MSK-IMPACT assay. The numbers in the parentheses are the total number of sequenced tumors. (cBioPortal.org).

