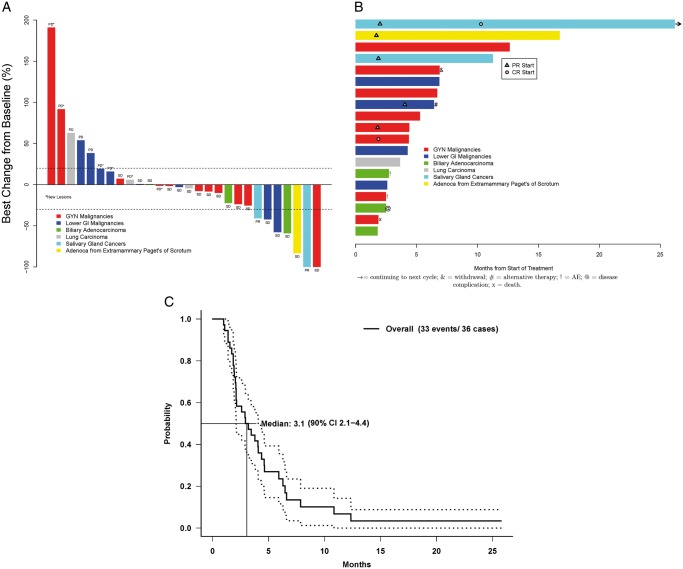
Figure 3.
(A) Efficacy: Best% change from baseline (n = 28). Four patients had PD based on new lesions but data for the target lesions are not available so not included in this plot. (B) Treatment Duration in patients who achieved SD or PR. (C) Kaplan–Meier curve for progression-free survival. GYN, gynecological; CI, confidence interval; GI, gastrointestinal.

