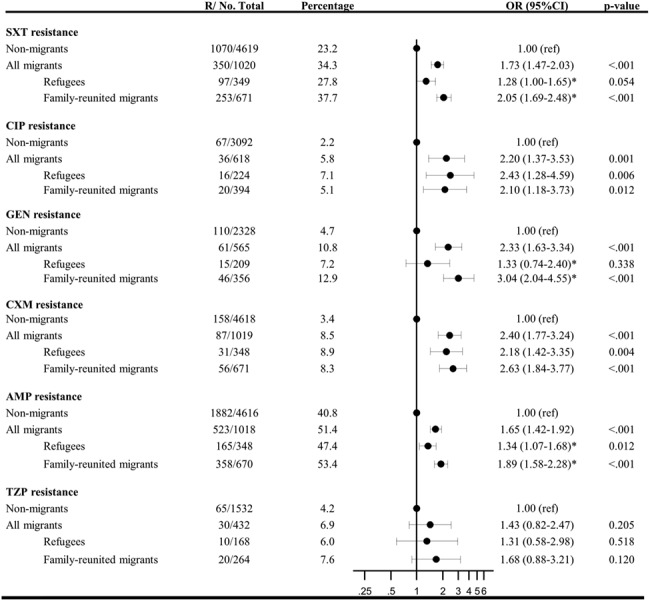
Figure 2. Antibiotic susceptibility among E. coli isolates in first-time urine samples from migrants and non-migrants from 2000 to 2015. OR adjusted for test year, Charlson index, income, sex and age at test. R/No. total, resistant isolates/total number of isolates tested. *Significant difference between OR for family-reunited and refugees (SXT P < 0.001, GEN P = 0.004, AMP P = 0.002).