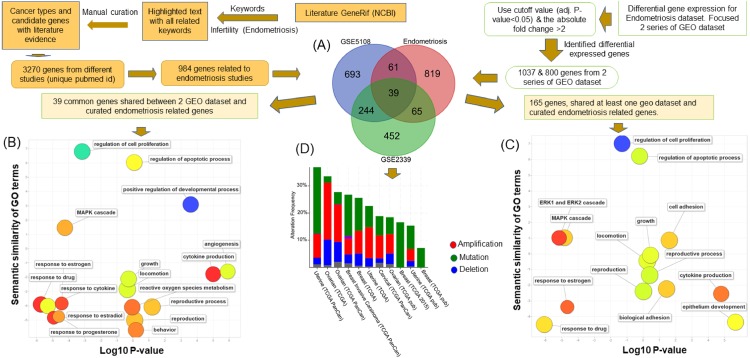
Figure 1. Pipeline to identify the association between endometriosis disease and four cancers of women.
The flow chart shows the pipeline to discover the common implicated genes in endometriosis disease and four cancers of women. This process had several steps. The first (A) involved identification of endometriosis-related genes from GeneRif and through manually curating data from the literature. This enabled us to extract the corresponding gene names in human and overlapping analysis of curated endometriosis-related genes and two sets (GSE2339 and GSE5108) of the GEO dataset. Thirty-nine genes were common to the curated endometriosis-related gene and two datasets of GEO and 165 genes common to endometriosis-related gene and one set of GEO. (B) Functional enrichment analysis of 39 genes common to three data sets. (C) Functional enrichment analysis of 165 (39 + 65 + 61) genes shared by at least one GEO dataset and curated endometriosis gene list. The scatterplots of (B) and (C) present the summarized GO terms of all endometriosis-related genes. Circles show the GO clusters and are plotted in two-dimensional space according to other GO term semantic similarities. Y-axis demonstrates the similarity of the GO terms; x-axis indicates the log of corrected P-value; circle colour represents the frequency of the GO term in the Gene Ontology Annotation (GOA) database. (D) The cancer type summary of the 39 genes. The Y-axis shows the alteration frequency in percentage (including both amplification and deletion mutation); the x-axis indicates the cancer types. Blue, Deletion; Red, Amplification; Green, Mutation; and Grey, Multiple Alterations.

