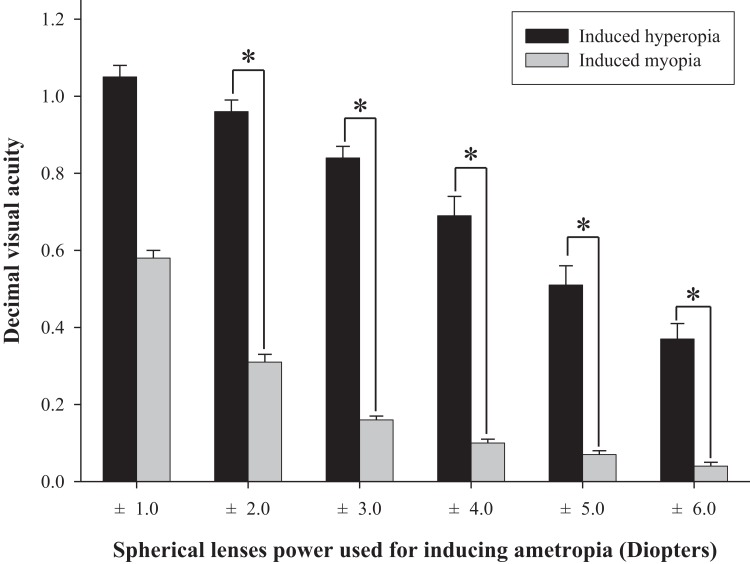
Figure 3. Comparison of binocular decimal visual acuity between hyperopic and myopic refractive errors induced by (±) spherical lenses.
*Significantly different in visual acuity between induced hyperopia and myopia under similar lens power according to paired-t test. Error bars indicate the standard error (SE) of the mean.

