. 2019 Dec;21(2):309–323.

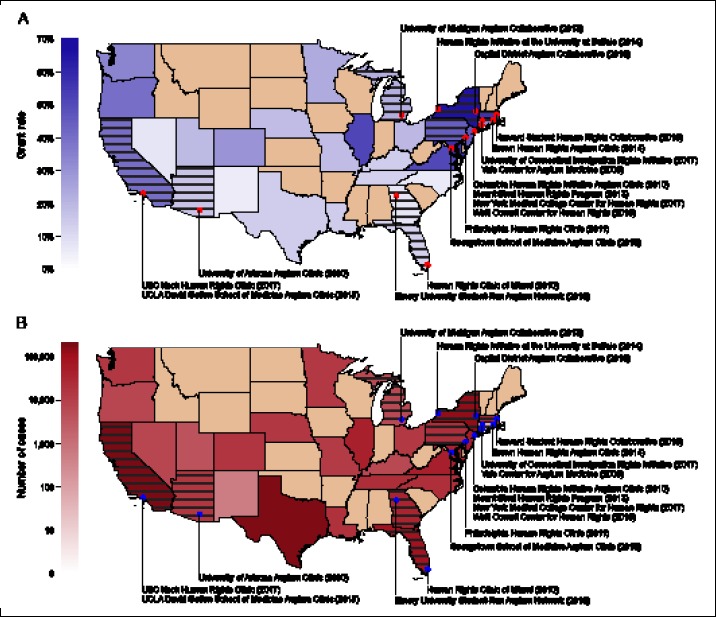
Figure S1.

(a) Map showing the statewide rate at which immigration courts granted applicants asylum or another form of legal protection in 2018. This data, taken from TRAC, contains both affirmative and defensive applications decided by immigration courts, but excludes applications decided by USCIS. Darker shades of blue correspond to higher rates along a linear scale as indicated by the color bar. Rates range from 5.5% to 65.6%, the median rate is 21.1%, the national rate across all decisions is 34.7%, and averaging the statewide rates yields 27.8%. (b) Map showing the backlog of pending cases in the immigration courts by state as of October 2019. Darker shades of red correspond to larger backlogs along a logarithmic scale as indicated by the color bar. In both panels, tan indicates states without immigration courts and striped states are home to student-run asylum clinics that are marked by red (a) or blue (b) dots. Data for both panels were taken from the sources listed in reference 11 of the main text.

Asylum decisions and backlogs by state.